OPEN-SOURCE SCRIPT
Crystal Cloud EMA
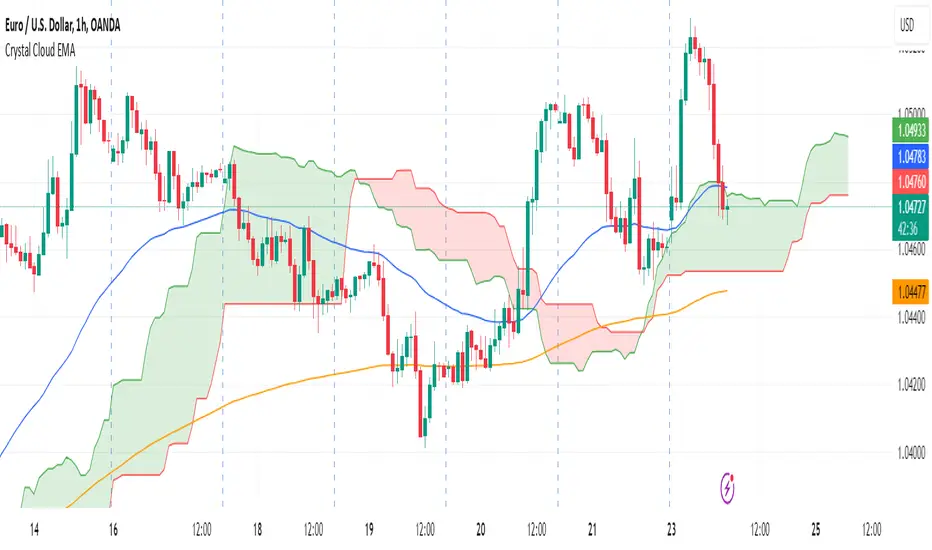
# Crystal Cloud EMA Indicator 🚀
The **Crystal Cloud EMA Indicator** is a hybrid technical analysis tool that uniquely merges the multi-dimensional perspective of the Ichimoku Cloud with the precision of EMA crossovers (EMA 50 & EMA 200). This integration is designed to help traders identify key market trends, dynamic support and resistance zones, and potential momentum shifts with enhanced clarity and reliability.
---
## Key Components & Originality
### Ichimoku Cloud
- **Dynamic Support & Resistance:**
Utilizes standard Ichimoku calculations to form a cloud (Kumo) that highlights areas where price may find support or resistance.
- **Visual Clarity:**
The cloud’s upper and lower boundaries provide clear visual cues of market sentiment, helping to identify potential reversal or consolidation zones.
### EMA 50 & EMA 200
- **Trend Confirmation:**
These exponential moving averages smooth price data to reveal underlying trends.
- **Crossover Signals:**
A crossover of EMA 50 and EMA 200 is used as a signal confirmation—when EMA 50 crosses above EMA 200, it suggests a bullish trend; when it crosses below, it indicates a bearish trend.
### Unique Integration
- **Combined Analysis for Enhanced Accuracy:**
By fusing the Ichimoku Cloud’s dynamic support/resistance zones with the precise timing of EMA crossovers, the indicator minimizes false signals.
- **Confluence of Methods:**
Only when both the cloud position and EMA crossover align does the indicator generate a trading signal, offering a more robust framework than using either method in isolation.
---
## How It Works
1. **Cloud Evaluation:**
- The indicator calculates the Ichimoku Cloud using traditional parameters, establishing dynamic zones where price reactions are likely.
- It monitors how price interacts with these zones, signaling potential momentum shifts when the price moves in or out of the cloud.
2. **EMA Crossover Analysis:**
- Simultaneously, it computes EMA 50 and EMA 200.
- **Bullish Condition:** When price is above the cloud and EMA 50 crosses above EMA 200.
- **Bearish Condition:** When price is below the cloud and EMA 50 crosses below EMA 200.
3. **Signal Confirmation:**
- A breakout from the cloud, in conjunction with a crossover, further validates the strength of the trend.
- This dual confirmation approach filters out market noise and increases the reliability of the signals.
---
## Trading Strategy & Usage
### Buy Signal
- **Conditions:**
- Price is trading above the Ichimoku Cloud.
- EMA 50 crosses above EMA 200.
- A confirmed breakout above the cloud supports the bullish trend.
- **Application:**
- Enter long positions when these conditions align.
- Use the cloud’s lower boundary for potential stop-loss placement and set profit targets based on key resistance levels identified by the cloud.
### Sell Signal
- **Conditions:**
- Price is trading below the Ichimoku Cloud.
- EMA 50 crosses below EMA 200.
- A breakdown below the cloud reinforces the bearish trend.
- **Application:**
- Enter short positions under these conditions.
- Use the cloud’s upper boundary as a reference for setting stop-loss orders and profit targets.
### Best Timeframes & Trading Styles
- **Timeframes:**
Optimally used on M30 and higher timeframes to ensure trend reliability and reduce market noise.
- **Trading Styles:**
Suitable for swing trading, intraday trading, and momentum-based strategies.
- **Risk Management:**
Always complement indicator signals with additional analysis (like volume or price action) and apply proper risk management techniques.
---
## Important Note
This indicator is a **technical analysis tool** designed to assist traders in identifying market trends and potential reversal points. It should be used in conjunction with comprehensive market analysis and proper risk management. Trading decisions should not rely solely on this indicator.
Open-source script
In true TradingView spirit, the creator of this script has made it open-source, so that traders can review and verify its functionality. Kudos to the author! While you can use it for free, remember that republishing the code is subject to our House Rules.
Disclaimer
The information and publications are not meant to be, and do not constitute, financial, investment, trading, or other types of advice or recommendations supplied or endorsed by TradingView. Read more in the Terms of Use.