PROTECTED SOURCE SCRIPT
Crypto Strength Matrix
Overview
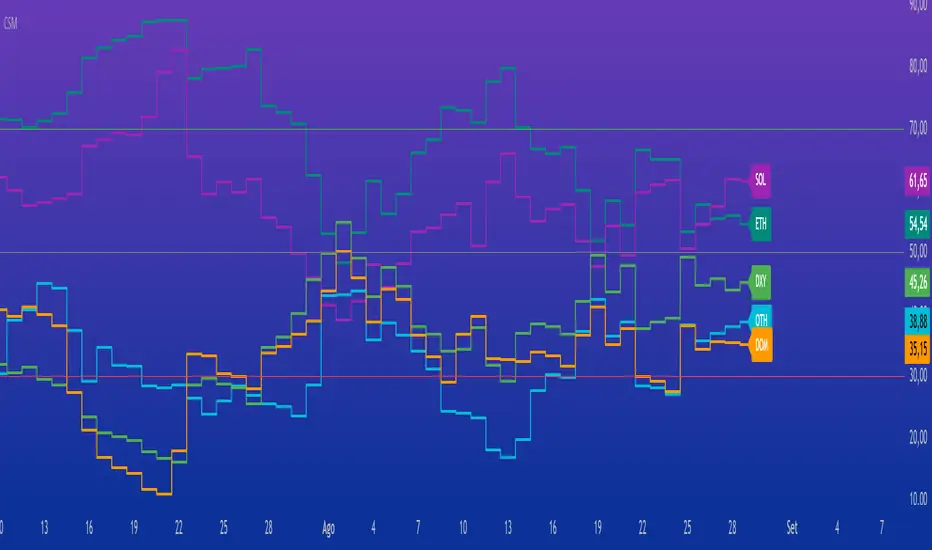
The "Crypto Strength Matrix" is a custom Pine Script v5 indicator designed for cryptocurrency traders to assess the relative strength of major crypto market segments against traditional markets (e.g., the U.S. Dollar Index) and Bitcoin dominance. This indicator plots the strength of Altcoins (excluding ETH and SOL), Ethereum (ETH), Solana (SOL), the Dollar Index (DXY) versus Altcoins, and Bitcoin Dominance (DOM) on a 0-100 scale, using the Relative Strength Index (RSI) methodology. It provides a visual and intuitive way to identify overbought (>70) or oversold (<30) conditions across these assets, helping traders spot potential entry or exit points in the crypto market.
How It Works
The indicator fetches real-time data from various crypto and forex symbols available on TradingView, including:
CRYPTOCAP:TOTAL2 (total altcoin market cap),
CRYPTOCAP:ETH and CRYPTOCAP:SOL (market caps of ETH and SOL),
CRYPTO:ETHUSD and CRYPTO:SOLUSD (ETH and SOL prices),
CRYPTOCAP:BTC.D (Bitcoin dominance),
TVC:DXY (U.S. Dollar Index).
Calculations:
Altcoin Strength (OTH): Measures the RSI of the normalized market cap of all altcoins excluding ETH and SOL (calculated as TOTAL2 - ETH - SOL), relative to the total altcoin market cap. This reflects the strength of smaller altcoins.
ETH Strength: Computes the RSI of ETH/USD price adjusted by the DXY, isolating ETH's performance against the dollar.
SOL Strength: Similar to ETH, calculates the RSI of SOL/USD price adjusted by the DXY, focusing on Solana's strength.
DXY vs Altcoins: Uses the RSI of the DXY divided by the normalized total altcoin market cap, indicating the dollar's strength relative to altcoins.
Bitcoin Dominance (DOM): Directly applies RSI to Bitcoin dominance data, showing BTC's market control.
Each metric is plotted as a line with a unique color (OTH in aqua, ETH in teal, SOL in purple, DXY in green, DOM in orange) and labeled at the end of the chart for easy identification. Horizontal lines at 70 (overbought), 50 (neutral), and 30 (oversold) provide reference levels.
How to Use
Add the Indicator: Apply the "Crypto Strength Matrix" to a cryptocurrency chart (e.g., BTC/USD or ETH/USD) on a daily or 4-hour timeframe for optimal results.
Interpret the Lines:
OTH (Altcoins excluding ETH and SOL): A value above 70 suggests strong momentum in smaller altcoins, while below 30 indicates weakness. Monitor for divergence with ETH and SOL.
ETH and SOL: High values (>70) signal potential overbought conditions for these assets, while low values (<30) may indicate oversold opportunities.
DXY: Rising above 70 may suggest a stronger dollar, potentially pressuring crypto prices, while below 30 could indicate a weakening dollar, favoring crypto.
DOM: A value above 70 reflects strong Bitcoin dominance, often leading to altcoin underperformance, while below 30 may signal altcoin season.
Combine with Price Action: Use the indicator alongside candlestick patterns or volume analysis to confirm trade signals.
Adjust RSI Length: The default RSI length is 14, but you can tweak this input in the indicator settings to suit your trading style (e.g., 7 for shorter-term, 21 for longer-term trends).
Monitor Trends: Look for crossovers between lines (e.g., OTH rising above DXY) or alignment with the 50 neutral line to gauge market shifts.
Tips
Timeframe Selection: Daily charts provide a broad market view, while 4-hour charts offer more frequent signals. Avoid very short timeframes (e.g., 5m) due to noise.
Contextual Awareness: Combine with macroeconomic news (e.g., U.S. dollar strength) and Bitcoin price movements for better decision-making.
Risk Management: Use the indicator as a supplementary tool, not a standalone signal, and always set stop-losses based on your risk tolerance.
This indicator is ideal for crypto traders seeking a comprehensive view of market dynamics without the complexity of multiple charts. Enjoy trading with the "Crypto Strength Matrix"!
Protected script
This script is published as closed-source. However, you can use it freely and without any limitations – learn more here.
Disclaimer
The information and publications are not meant to be, and do not constitute, financial, investment, trading, or other types of advice or recommendations supplied or endorsed by TradingView. Read more in the Terms of Use.