OPEN-SOURCE SCRIPT
Bollinger Bands Squeeze
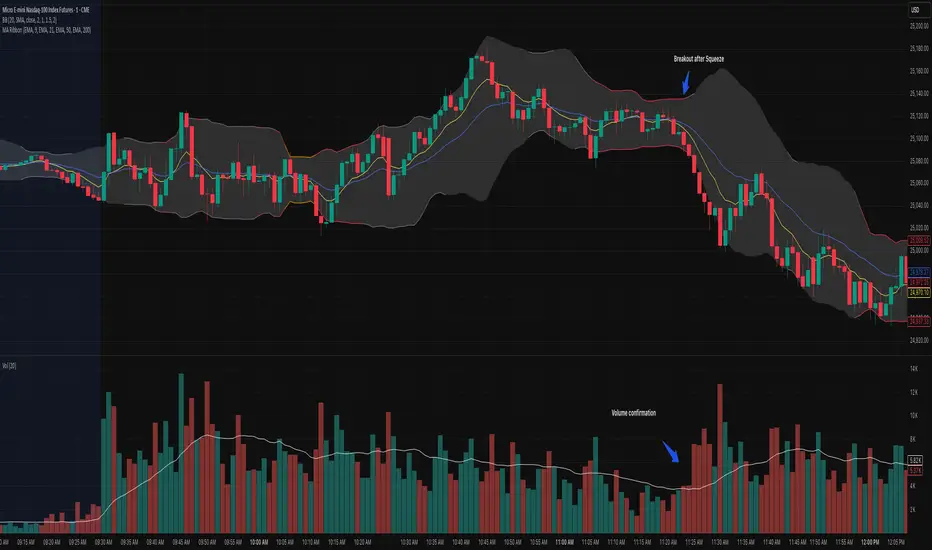
📈 Bollinger Bands Squeeze
This indicator enhances traditional Bollinger Bands by integrating Keltner Channel layers to visualize market compression and volatility expansion — allowing traders to easily identify when a squeeze is building or releasing.
🔍 Overview
This is a refined version of the classic Bollinger Bands, designed to detect volatility squeezes using multiple Keltner Channel thresholds.
The script plots standard Bollinger Bands and dynamically colors the bands according to the degree of compression relative to the Keltner Channels.
⚙️ How It Works
Bollinger Bands are calculated from a selected moving average (SMA, EMA, SMMA, WMA, or VWMA) and standard deviation multiplier.
Keltner Channels are derived from ATR (True Range) using three sensitivity levels (1.0, 1.5, and 2.0× multipliers).
When Bollinger Bands contract inside a Keltner Channel, the script marks a squeeze state:
🟠 High Compression (Orange): Very tight volatility — expect breakout soon.
🔴 Mid Compression (Red): Moderate contraction — volatility is building.
⚫ Low Compression (Gray/Black): Early compression phase.
🧩 Inputs & Customization
Length: Period for both Bollinger and Keltner calculations.
Basis MA Type: Choose from SMA, EMA, SMMA (RMA), WMA, or VWMA.
StdDev Multiplier: Controls Bollinger Bandwidth.
Keltner Multipliers (1.0 / 1.5 / 2.0): Adjust compression thresholds.
Offset: Shifts the bands visually on the chart.
🕹️ Best Use Cases
Identify pre-breakout conditions before volatility expansion.
Combine with volume, momentum, or trend indicators (e.g., RSI) for confirmation.
Ideal for scalping, breakout trading, or volatility-based entries during session opens.
Open-source script
In true TradingView spirit, the creator of this script has made it open-source, so that traders can review and verify its functionality. Kudos to the author! While you can use it for free, remember that republishing the code is subject to our House Rules.
Disclaimer
The information and publications are not meant to be, and do not constitute, financial, investment, trading, or other types of advice or recommendations supplied or endorsed by TradingView. Read more in the Terms of Use.