PROTECTED SOURCE SCRIPT
Smart Buyer by [Imagine Income]
Smart Buyer Indicator
The "Smart Buyer" indicator identifies optimal entry points for long positions by analyzing the behavior patterns of institutional investors and smart money. This indicator helps traders find the best buying opportunities when professional traders typically accumulate positions.
Key Criteria
The indicator combines multiple technical analysis factors to identify smart buying opportunities:
RSI Oversold Conditions
Detects oversold levels (but not extreme) to avoid catching falling knives
Filters out panic selling while identifying genuine buying opportunities
Price Near Lower Bollinger Band
Identifies when price is trading near the lower Bollinger Band
Ensures buying at the best possible prices within the current range
Increased Volume
Confirms buyer interest through above-average volume
Validates the legitimacy of the potential reversal
Uptrend Confirmation
Only triggers buy signals in an overall upward trend
Ensures alignment with the dominant market direction using EMA crossovers
Reversal Candlestick Patterns
Detects hammer and doji formations
Identifies potential reversal points at key support levels
Proximity to Support Levels
Analyzes pivot lows to identify technical support zones
Increases probability of successful entries near established support
Signal Types
🟢 SB (Smart Buy)
Standard smart buyer signal when multiple criteria align
Indicates a good entry opportunity for long positions
🟢 SB+ (Strong Buy)
Enhanced signal with all criteria met plus low volatility
Represents the highest probability entry points
Visual Elements
Green Background Zone
Highlights optimal buying areas
Shows price ranges where smart money typically accumulates
Yellow Dotted Lines
Mark key support levels based on pivot analysis
Help identify areas where price is likely to find buying interest
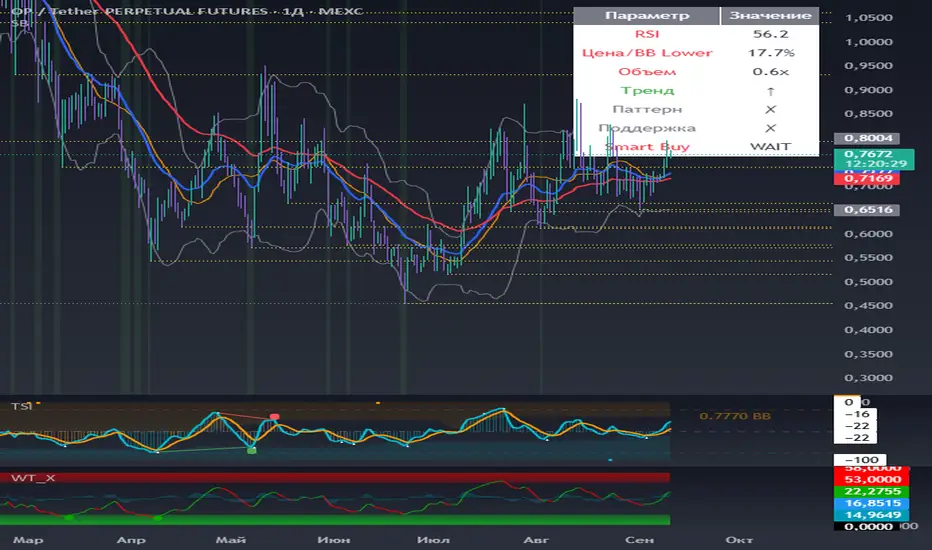
Information Table
Real-time display of all indicator parameters
Shows current status of RSI, volume, trend, and other factors
Color-coded for quick assessment (green = bullish, red = bearish)
Settings & Customization
Fully Customizable Parameters
RSI period and oversold levels
Bollinger Bands settings (period and multiplier)
EMA periods for trend analysis
Volume threshold multipliers
Pivot analysis periods
Alert System
Built-in alerts for both standard and strong buy signals
Customizable alert messages for different signal types
Display Options
Toggle signals, zones, and support levels independently
Adapt the indicator appearance to your charting preferences
Optimal Usage
Best Timeframe: Daily
Designed primarily for daily timeframe analysis
Filters out short-term noise while capturing meaningful reversals
Market Application
Works best in trending markets with periodic pullbacks
Ideal for swing trading and position building strategies
Helps identify accumulation zones used by institutional investors
Trading Logic
This indicator replicates the behavior of smart money by:
Buying pullbacks in uptrending markets rather than chasing momentum
Using limit orders at technical support levels
Confirming entries with volume and momentum indicators
Avoiding panic selling by filtering extreme oversold conditions
The Smart Buyer indicator helps retail traders think and act like institutional investors, focusing on high-probability setups where risk-reward ratios are most favorable.
The "Smart Buyer" indicator identifies optimal entry points for long positions by analyzing the behavior patterns of institutional investors and smart money. This indicator helps traders find the best buying opportunities when professional traders typically accumulate positions.
Key Criteria
The indicator combines multiple technical analysis factors to identify smart buying opportunities:
RSI Oversold Conditions
Detects oversold levels (but not extreme) to avoid catching falling knives
Filters out panic selling while identifying genuine buying opportunities
Price Near Lower Bollinger Band
Identifies when price is trading near the lower Bollinger Band
Ensures buying at the best possible prices within the current range
Increased Volume
Confirms buyer interest through above-average volume
Validates the legitimacy of the potential reversal
Uptrend Confirmation
Only triggers buy signals in an overall upward trend
Ensures alignment with the dominant market direction using EMA crossovers
Reversal Candlestick Patterns
Detects hammer and doji formations
Identifies potential reversal points at key support levels
Proximity to Support Levels
Analyzes pivot lows to identify technical support zones
Increases probability of successful entries near established support
Signal Types
🟢 SB (Smart Buy)
Standard smart buyer signal when multiple criteria align
Indicates a good entry opportunity for long positions
🟢 SB+ (Strong Buy)
Enhanced signal with all criteria met plus low volatility
Represents the highest probability entry points
Visual Elements
Green Background Zone
Highlights optimal buying areas
Shows price ranges where smart money typically accumulates
Yellow Dotted Lines
Mark key support levels based on pivot analysis
Help identify areas where price is likely to find buying interest
Information Table
Real-time display of all indicator parameters
Shows current status of RSI, volume, trend, and other factors
Color-coded for quick assessment (green = bullish, red = bearish)
Settings & Customization
Fully Customizable Parameters
RSI period and oversold levels
Bollinger Bands settings (period and multiplier)
EMA periods for trend analysis
Volume threshold multipliers
Pivot analysis periods
Alert System
Built-in alerts for both standard and strong buy signals
Customizable alert messages for different signal types
Display Options
Toggle signals, zones, and support levels independently
Adapt the indicator appearance to your charting preferences
Optimal Usage
Best Timeframe: Daily
Designed primarily for daily timeframe analysis
Filters out short-term noise while capturing meaningful reversals
Market Application
Works best in trending markets with periodic pullbacks
Ideal for swing trading and position building strategies
Helps identify accumulation zones used by institutional investors
Trading Logic
This indicator replicates the behavior of smart money by:
Buying pullbacks in uptrending markets rather than chasing momentum
Using limit orders at technical support levels
Confirming entries with volume and momentum indicators
Avoiding panic selling by filtering extreme oversold conditions
The Smart Buyer indicator helps retail traders think and act like institutional investors, focusing on high-probability setups where risk-reward ratios are most favorable.
Protected script
This script is published as closed-source. However, you can use it freely and without any limitations – learn more here.
Disclaimer
The information and publications are not meant to be, and do not constitute, financial, investment, trading, or other types of advice or recommendations supplied or endorsed by TradingView. Read more in the Terms of Use.