OPEN-SOURCE SCRIPT
Updated QQE Student's T-Distribution Bollinger Bands Screener
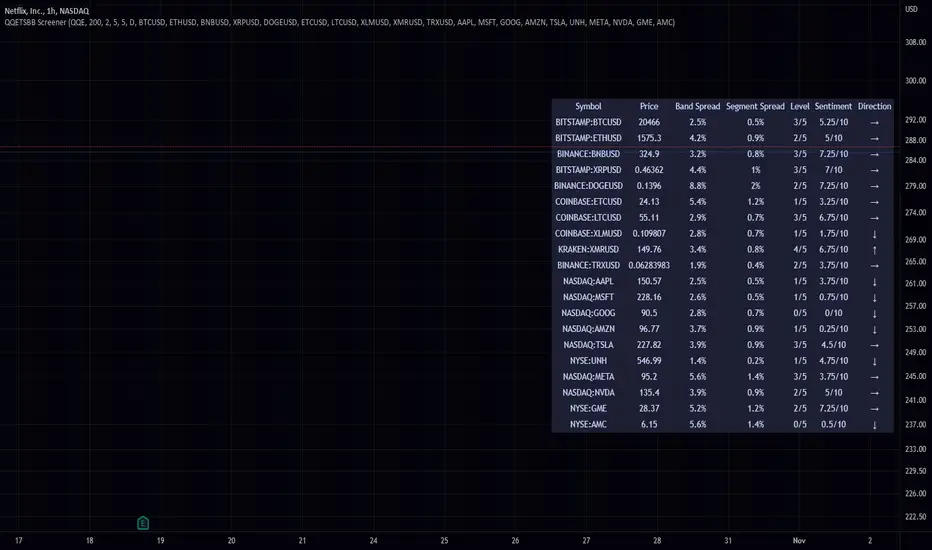
This script scans 20 custom symbols and displays the QQE Students T-Distribution Bollinger Bandwidth as a percentage, the quarter segment percentage, a score that tells you what segment of the band the price is in, and what direction the market is going in. This is useful because it can tell you how volatile a market is and how much reward is in the market. It also tells you what direction the market is going in so you can pick a symbol that has the best looking reward. I really hope that this script complements the group of indicators I have made so far. Here is a list of the other two indicators related to this script.


Please enjoy!
Please enjoy!
Release Notes
added price lolRelease Notes
added the option to use traditional moving averages instead of the qqe.Release Notes
Added tool tips and a sentiment tracker. I renamed Score to Level.Release Notes
middle right is more practical Release Notes
added a symbol group and rearranged the code a bit. Release Notes
Updated the sentiment score to reflect the changes I made to the oscillator. ie I added heikin ashi to the scoreing system. (that being said its actually line break heikin ashi!)Release Notes
made it usable for every oneRelease Notes
Now you can change the location on your screen.Release Notes
fixed bugOpen-source script
In true TradingView spirit, the creator of this script has made it open-source, so that traders can review and verify its functionality. Kudos to the author! While you can use it for free, remember that republishing the code is subject to our House Rules.
Disclaimer
The information and publications are not meant to be, and do not constitute, financial, investment, trading, or other types of advice or recommendations supplied or endorsed by TradingView. Read more in the Terms of Use.
Open-source script
In true TradingView spirit, the creator of this script has made it open-source, so that traders can review and verify its functionality. Kudos to the author! While you can use it for free, remember that republishing the code is subject to our House Rules.
Disclaimer
The information and publications are not meant to be, and do not constitute, financial, investment, trading, or other types of advice or recommendations supplied or endorsed by TradingView. Read more in the Terms of Use.