PINE LIBRARY
CoreTFRSIMD
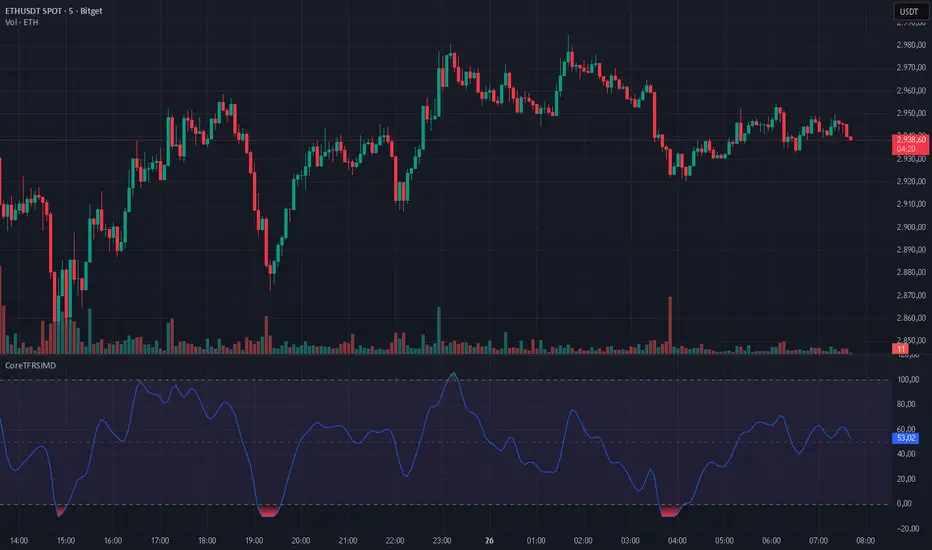
CoreTFRSIMD library — Reusable TFRSI core for consistent momentum inputs across scripts
The library provides a reusable exported function such as calcTfrsi(src, len, signalLen) so you can compute TFRSI in your own indicators or strategies, e.g. tfrsi = CoreTFRSIMD.calcTfrsi(close, 6, 2)
Summary
CoreTFRSIMD is a Pine Script v6 library that implements a TFRSI-style oscillator core and exposes it as a reusable exported function. It is designed for authors who want the same TFRSI calculation across multiple indicators or strategies without duplicating logic. The library includes a simple demo plot and band styling so you can visually sanity-check the output. No higher-timeframe sampling is used, and there are no loops or arrays, so runtime cost is minimal for typical chart usage.
Motivation: Why this design?
When you reuse an oscillator across different tools, small implementation differences create inconsistent signals and hard-to-debug results. This library isolates the signal path into one exported function so that every dependent script consumes the exact same oscillator output. The design combines filtering, normalization, and a final smoothing pass to produce a stable, RSI-like readout intended for momentum and regime context.
What’s different vs. standard approaches?
Baseline: Traditional RSI computed directly from gains and losses with standard smoothing.
Architecture differences:
A high-pass stage to attenuate slower components before the main smoothing.
A multi-pole smoothing stage implemented with persistent state to reduce noise.
A running peak-tracker style normalization that adapts to changing signal amplitude.
A final signal smoothing layer using a simple moving average.
Practical effect:
The oscillator output tends to be less dominated by raw volatility spikes and more consistent across changing conditions.
The normalization step helps keep the output in an RSI-like reading space without relying on fixed scaling.
How it works (technical)
1. Input source: The exported function accepts a source series and two integer parameters controlling responsiveness and final smoothing.
2. High-pass stage: A recursive filter is applied to the source to emphasize shorter-term movement. This stage uses persistent storage so it can reference prior internal states across bars.
3. Smoothing stage: The filtered stream is passed through a SuperSmoother-like recursive smoother derived from the chosen length. This again uses persistent state and prior values for continuity.
4. Adaptive normalization: The absolute magnitude of the smoothed stream is compared to a slowly decaying reference level. If the current magnitude exceeds the reference, the reference is updated. This acts like a “peak hold with decay” so the oscillator scales relative to recent conditions.
5. Oscillator mapping: The normalized value is mapped into an RSI-like reading range.
6. Signal smoothing: A simple moving average is applied over the requested signal length to reduce bar-to-bar chatter.
7. Demo rendering: The library script plots the oscillator, draws horizontal guide levels, and applies background plus gradient fills for overbought and oversold regions.
Parameter Guide
Parameter — Effect — Default — Trade-offs/Tips
src — Input series used by the oscillator — close in demo — Use close for general momentum, or a derived series if you want to emphasize a specific behavior.
len — Controls the responsiveness of internal filtering and smoothing — six in demo — Smaller values react faster but can increase short-term noise; larger values smooth more but can lag turns.
signalLen — Controls the final smoothing of the mapped oscillator — two in demo — Smaller values preserve detail but can flicker; larger values reduce flicker but can delay transitions.
Reading & Interpretation
The plot is an oscillator intended to be read similarly to an RSI-style momentum gauge.
The demo includes three reference levels: upper at one hundred, mid at fifty, and lower at zero.
The fills visually emphasize zones above the midline and below the midline. Treat these as context, not as standalone entries.
If the oscillator appears unusually compressed or unusually jumpy, the normalization reference may be adapting to an abrupt change in amplitude. That is expected behavior for adaptive normalization.
Practical Workflows & Combinations
Trend following:
Use structure first, then confirm with oscillator behavior around the midline.
Prefer signals aligned with higher-high higher-low or lower-low lower-high context from price.
Exits/Stops:
Use oscillator loss of momentum as a caution flag rather than an automatic exit trigger.
In strong trends, consider keeping risk rules price-based and use the oscillator mainly to avoid adding into exhaustion.
Multi-asset/Multi-timeframe:
Start with the demo defaults when you want a responsive oscillator.
If an asset is noisier, increase the main length or the signal smoothing length to reduce false flips.
Behavior, Constraints & Performance
Repaint/confirmation: No higher-timeframe sampling is used. Output updates on the live bar like any normal series. There is no explicit closed-bar gating in the library.
security or HTF: Not used, so there is no HTF synchronization risk.
Resources: No loops, no arrays, no large history buffers. Persistent variables are used for filter state.
Known limits: Like any filtered oscillator, sharp gaps and extreme one-bar events can produce transient distortions. The adaptive normalization can also make early bars unstable until enough history has accumulated.
Sensible Defaults & Quick Tuning
Starting values: length six, signal smoothing two.
Too many flips: Increase signal smoothing length, or increase the main length.
Too sluggish: Reduce the main length, or reduce signal smoothing length.
Choppy around midline: Increase signal smoothing length slightly and rely more on price structure filters.
What this indicator is—and isn’t
This library is a reusable signal component and visualization aid. It is not a complete trading system, not predictive, and not a substitute for market structure, execution rules, and risk controls. Use it as a momentum and regime context layer, and validate behavior per asset and timeframe before relying on it.
Disclaimer
The content provided, including all code and materials, is strictly for educational and informational purposes only. It is not intended as, and should not be interpreted as, financial advice, a recommendation to buy or sell any financial instrument, or an offer of any financial product or service. All strategies, tools, and examples discussed are provided for illustrative purposes to demonstrate coding techniques and the functionality of Pine Script within a trading context.
Any results from strategies or tools provided are hypothetical, and past performance is not indicative of future results. Trading and investing involve high risk, including the potential loss of principal, and may not be suitable for all individuals. Before making any trading decisions, please consult with a qualified financial professional to understand the risks involved.
By using this script, you acknowledge and agree that any trading decisions are made solely at your discretion and risk.
Do not use this indicator on Heikin-Ashi, Renko, Kagi, Point-and-Figure, or Range charts, as these chart types can produce unrealistic results for signal markers and alerts.
Best regards and happy trading
Chervolino
Pine library
In true TradingView spirit, the author has published this Pine code as an open-source library so that other Pine programmers from our community can reuse it. Cheers to the author! You may use this library privately or in other open-source publications, but reuse of this code in publications is governed by House Rules.
Disclaimer
The information and publications are not meant to be, and do not constitute, financial, investment, trading, or other types of advice or recommendations supplied or endorsed by TradingView. Read more in the Terms of Use.