OPEN-SOURCE SCRIPT
Updated Linear Regression 200/100/50/20
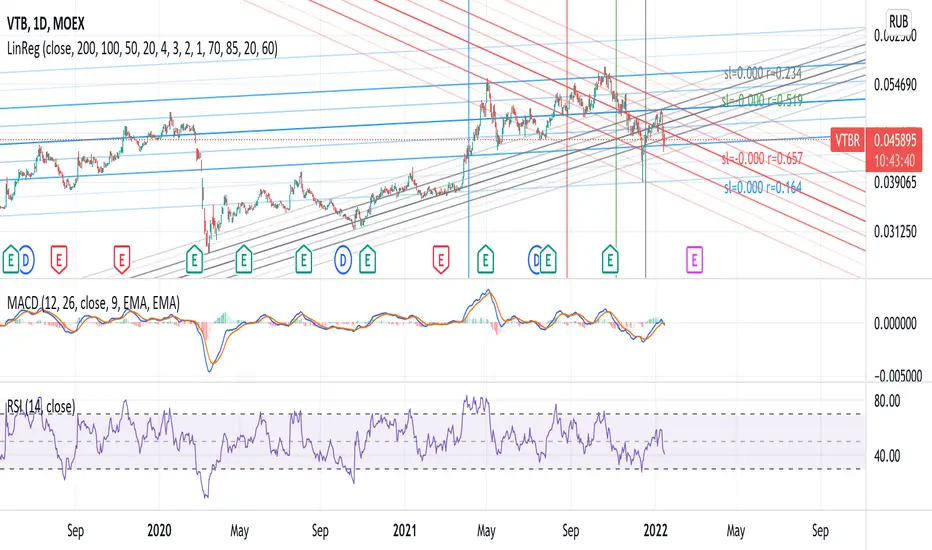
Four time frames in one indicator in different colors, showing current price trend in different scopes.
If the slope of the smaller time frame is in a (0,75;1,25) interval of some of the bigger ones the smaller one is omitted (different signs near zero are not coalesced in that way though).
Every time frame has four deltas of range in trend lines of different grade of transparency (2-1-4-3), as well as a vertical line denoting regression date range start, also bearing the same color (blue-red-green-gray for 200/100/50/20).
On the right of the latest bar are Pearson coefficients and slopes of the regressions, 200/100/50/20 bottom-up, also appropriately colored.
Release Notes
Some of the trends can now be disabled in the config.Parameter layout fixes.
Release Notes
Label format fix.Release Notes
Added exponential scale support, should be selected manually in the config.Minor fixes
Release Notes
Minor fix.Open-source script
In true TradingView spirit, the creator of this script has made it open-source, so that traders can review and verify its functionality. Kudos to the author! While you can use it for free, remember that republishing the code is subject to our House Rules.
Disclaimer
The information and publications are not meant to be, and do not constitute, financial, investment, trading, or other types of advice or recommendations supplied or endorsed by TradingView. Read more in the Terms of Use.
Open-source script
In true TradingView spirit, the creator of this script has made it open-source, so that traders can review and verify its functionality. Kudos to the author! While you can use it for free, remember that republishing the code is subject to our House Rules.
Disclaimer
The information and publications are not meant to be, and do not constitute, financial, investment, trading, or other types of advice or recommendations supplied or endorsed by TradingView. Read more in the Terms of Use.