OPEN-SOURCE SCRIPT
Updated zigzag support&resistance levels [LM]
Hello Traders,
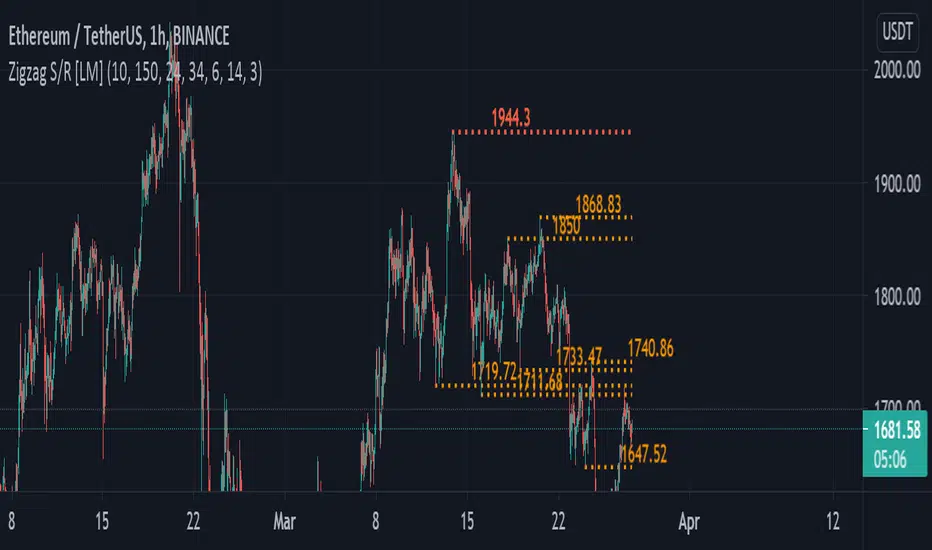
I would like to introduce you zigzag support&resistance levels. It is based on the ZigZag semafor script made by DevLucem so shout out to him
The Semafor is used to spot future multi-level Supports and Resistance zones.
It is also useful to spot HL or LL or HH or LH zones at different Depth settings.
The red zones are the extreme places where the market has a higher chance of reversing while the green zones have the lowest setting with lower chances of the market reversal
I have refactored script and extended it with the horizontals.
The lines can be extended like so if you want to see

The lines also can expire when the price will reach it you can change this in general settings:

Also you can use view from the original script with just label circles

Enjoy!
I would like to introduce you zigzag support&resistance levels. It is based on the ZigZag semafor script made by DevLucem so shout out to him
The Semafor is used to spot future multi-level Supports and Resistance zones.
It is also useful to spot HL or LL or HH or LH zones at different Depth settings.
The red zones are the extreme places where the market has a higher chance of reversing while the green zones have the lowest setting with lower chances of the market reversal
I have refactored script and extended it with the horizontals.
The lines can be extended like so if you want to see
The lines also can expire when the price will reach it you can change this in general settings:
Also you can use view from the original script with just label circles
Enjoy!
Release Notes
added alert on confirmation of new level, add it to your alarms and you will start getting alerts New level have been confirmed and details about which onesRelease Notes
alert is now shown only for visible levelsRelease Notes
fix of alert behaviorRelease Notes
update to version 5Open-source script
In true TradingView spirit, the creator of this script has made it open-source, so that traders can review and verify its functionality. Kudos to the author! While you can use it for free, remember that republishing the code is subject to our House Rules.
Disclaimer
The information and publications are not meant to be, and do not constitute, financial, investment, trading, or other types of advice or recommendations supplied or endorsed by TradingView. Read more in the Terms of Use.
Open-source script
In true TradingView spirit, the creator of this script has made it open-source, so that traders can review and verify its functionality. Kudos to the author! While you can use it for free, remember that republishing the code is subject to our House Rules.
Disclaimer
The information and publications are not meant to be, and do not constitute, financial, investment, trading, or other types of advice or recommendations supplied or endorsed by TradingView. Read more in the Terms of Use.