OPEN-SOURCE SCRIPT
Multi-Minute Interval Marker
Testing
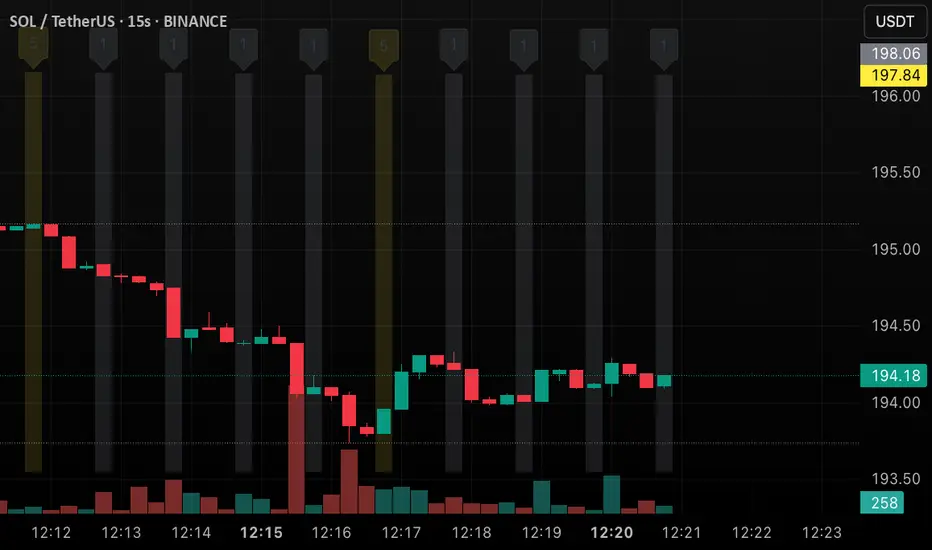
Apply this to a 15-second chart (e.g., SOL/USDT).
Verify that thin vertical lines with "1" (grey) and "5" (yellow) appear above the candles at 4-candle (1-minute) and 20-candle (5-minute) intervals, respectively.
The numbers should be positioned above the lines, and you can toggle the markers with show1Min and show5Min.
Open-source script
In true TradingView spirit, the creator of this script has made it open-source, so that traders can review and verify its functionality. Kudos to the author! While you can use it for free, remember that republishing the code is subject to our House Rules.
Disclaimer
The information and publications are not meant to be, and do not constitute, financial, investment, trading, or other types of advice or recommendations supplied or endorsed by TradingView. Read more in the Terms of Use.