OPEN-SOURCE SCRIPT
Oil ETF Volume
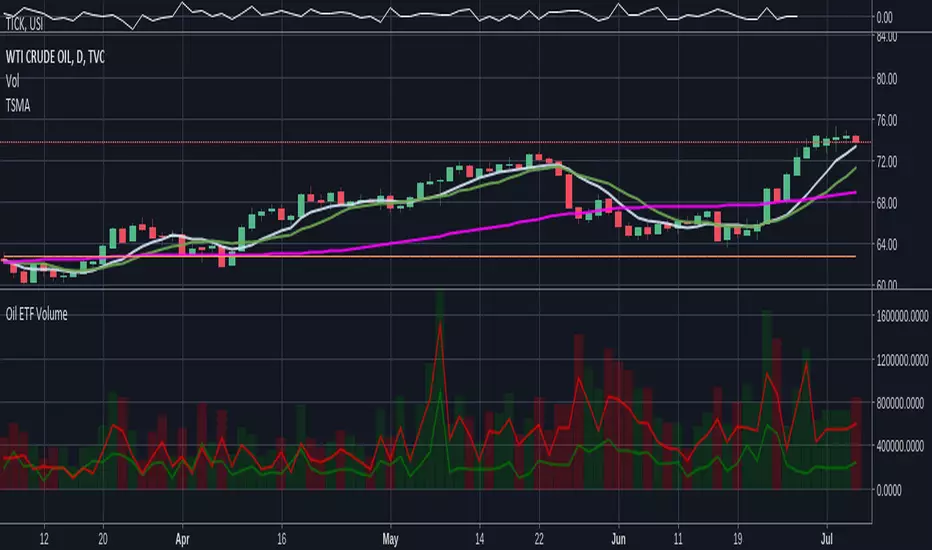
Direxxion Daily has both 'bear' and 'bull' oil ETFs. This tracks the volume in both combined. It also tracks them individually: the bear ETF is the red line, and bull the green.
NOTE: the color of the volume bars is determined by whatever ticker you're currently looking at, and whether current close is gt/lt previous close. It is intended to be used while looking at the USOIL chart. The colors will be inverted if you're looking at the 'bear' ETF! as the higher closes will actually mean price is going down :D
NOTE: the color of the volume bars is determined by whatever ticker you're currently looking at, and whether current close is gt/lt previous close. It is intended to be used while looking at the USOIL chart. The colors will be inverted if you're looking at the 'bear' ETF! as the higher closes will actually mean price is going down :D
Open-source script
In true TradingView spirit, the creator of this script has made it open-source, so that traders can review and verify its functionality. Kudos to the author! While you can use it for free, remember that republishing the code is subject to our House Rules.
Disclaimer
The information and publications are not meant to be, and do not constitute, financial, investment, trading, or other types of advice or recommendations supplied or endorsed by TradingView. Read more in the Terms of Use.