Multi-Period CCI Oscillator -> PROFABIGHI_CAPITAL
The Multi-Period CCI Oscillator → PROFABIGHI_CAPITAL blends multiple timeframes of the Commodity Channel Index into a weighted, smoothed composite for comprehensive momentum analysis. It helps traders detect overbought/oversold extremes, trend shifts, and consensus across fast-to-slow periods, reducing noise while highlighting directional biases.
📊 CCI Periods
– Fast CCI Length: Short-term period for capturing quick momentum swings.
– Medium CCI Length: Intermediate period for balanced trend insights.
– Slow CCI Length: Longer period for confirming sustained directions.
– Ultra Slow CCI Length: Extended period for overarching market regimes.
⚖️ Weights
– Fast/Medium/Slow/Ultra Slow Weights: Adjustable contributions to the composite, emphasizing preferred timeframes for customized sensitivity.
🛤️ Smoothing & Display
– Smoothing Length: EMA period to refine the overall composite line.
– Show Individual CCIs: Toggle to overlay separate CCI lines for component scrutiny.
📏 Levels
– Overbought/Oversold Levels: Thresholds signaling extreme momentum exhaustion.
– Neutral Upper/Lower: Boundaries defining transition zones between bull/bear biases.
🎨 Colors
– Bullish/Bearish/Neutral/Overbought/Oversold Colors: Custom tints for lines, zones, and signals to match trading themes.
📈 Signal Generation
– Composite Momentum: Weighted average of all CCIs, smoothed for clear trend velocity.
– Crossover Triggers: Bullish on breaks above oversold; bearish below overbought for reversal entries.
– Momentum Shifts: Positive crosses of zero or neutral upper for upside acceleration; negative for downside.
– Consensus Alignment: All CCIs positive for strong bullish; all negative for bearish conviction.
– Dominant Period: Identifies the strongest timeframe driving the signal for timeframe-specific focus.
– Strength Measure: Absolute composite value gauges overall momentum intensity.
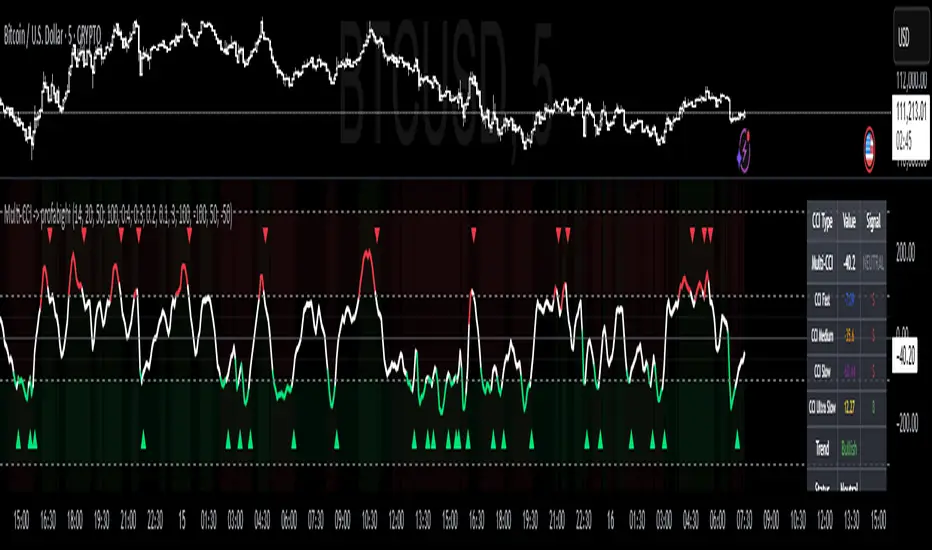
📉 Visualization
– Composite Line: Thick, zone-tinted plot shifting colors by level for instant bias reads.
– Individual Overlays: Faint lines for enabled CCIs when toggled, revealing timeframe divergences.
– Reference Lines: Dashed extremes, dotted neutrals, solid zero for quick threshold checks.
– Extreme Zones: Subtle fills beyond overbought/oversold for visual warning.
– Signal Markers: Tiny triangles at crossovers for buy/sell highlights.
– Consensus Background: Faint bullish/bearish shades when periods align.
– Info Table: Top-right panel with composite value/signal, individual readings, trend, status, consensus, and dominant period.
🔔 Alerts
– Crossover Notifications: For oversold buys or overbought sells.
– Momentum Warnings: On zero or neutral shifts.
– Consensus Flags: When all periods agree on direction.
✅ Key Takeaways
– Multi-timeframe weighting creates a holistic momentum view beyond single-period noise.
– Consensus and dominance add layers for high-conviction setups.
– Custom levels and visuals adapt to any style or timeframe.
– Smoothed composite sharpens reversals while table tracks component harmony.
Invite-only script
Only users approved by the author can access this script. You'll need to request and get permission to use it. This is typically granted after payment. For more details, follow the author's instructions below or contact PROFABIGHI_CAPITAL directly.
TradingView does NOT recommend paying for or using a script unless you fully trust its author and understand how it works. You may also find free, open-source alternatives in our community scripts.
Author's instructions
Disclaimer
Invite-only script
Only users approved by the author can access this script. You'll need to request and get permission to use it. This is typically granted after payment. For more details, follow the author's instructions below or contact PROFABIGHI_CAPITAL directly.
TradingView does NOT recommend paying for or using a script unless you fully trust its author and understand how it works. You may also find free, open-source alternatives in our community scripts.