OPEN-SOURCE SCRIPT
Updated Connors RSI (ValueRay)
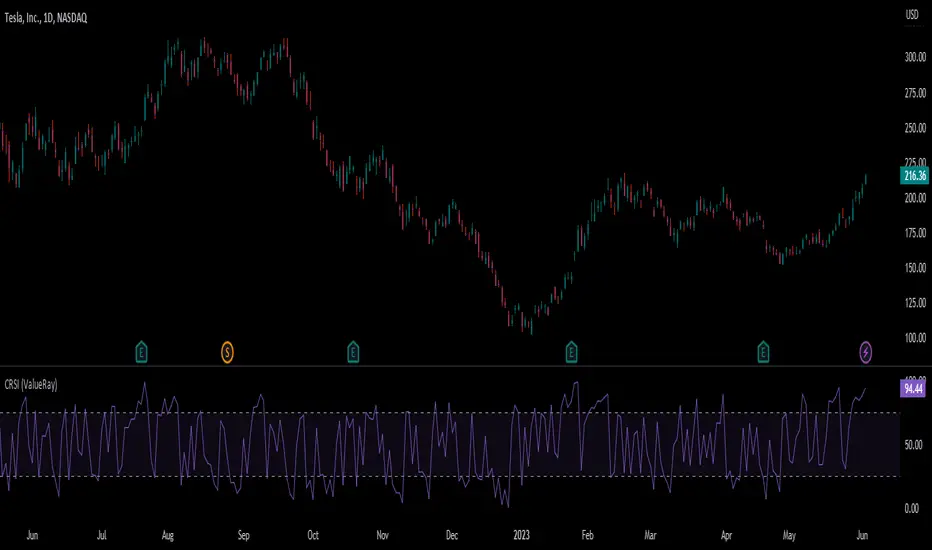
In compare to Tradingview Connors RSI, in this one you can choose which of the parts of the CRSI you want see:
The Connors RSI is a technical indicator developed by Larry Connors. It combines three different elements - price momentum, relative strength, and mean reversion - to identify potential buy and sell signals. The indicator measures the level of overbought or oversold conditions in a security, aiming to generate signals for short-term trading opportunities. It is widely used by traders to assess the strength and direction of price movements and to identify potential entry and exit points in the market.
- RSI
- Connors RSI
- Up/Down RSI
- Percent Rank
The Connors RSI is a technical indicator developed by Larry Connors. It combines three different elements - price momentum, relative strength, and mean reversion - to identify potential buy and sell signals. The indicator measures the level of overbought or oversold conditions in a security, aiming to generate signals for short-term trading opportunities. It is widely used by traders to assess the strength and direction of price movements and to identify potential entry and exit points in the market.
Release Notes
- removed link (house rules policy)
Open-source script
In true TradingView spirit, the creator of this script has made it open-source, so that traders can review and verify its functionality. Kudos to the author! While you can use it for free, remember that republishing the code is subject to our House Rules.
ValueRay ➤ AI driven Stock Screener and Value Analyser
Disclaimer
The information and publications are not meant to be, and do not constitute, financial, investment, trading, or other types of advice or recommendations supplied or endorsed by TradingView. Read more in the Terms of Use.