PROTECTED SOURCE SCRIPT
Cycle SR
Overview:
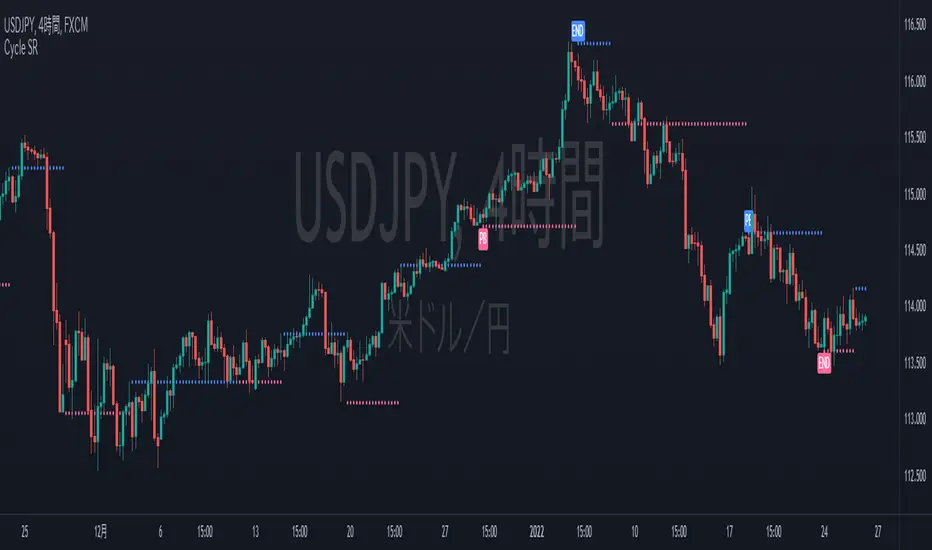
This indicator draws resistance and support lines calculated from market cycles.
By default, blue dots indicate resistance and red dots indicate support.
This indicator draws resistance and support lines calculated from market cycles.
By default, blue dots indicate resistance and red dots indicate support.
Protected script
This script is published as closed-source. However, you can use it freely and without any limitations – learn more here.
Disclaimer
The information and publications are not meant to be, and do not constitute, financial, investment, trading, or other types of advice or recommendations supplied or endorsed by TradingView. Read more in the Terms of Use.