PROTECTED SOURCE SCRIPT
Daily RVOL (Cumulative with Multi Alerts)
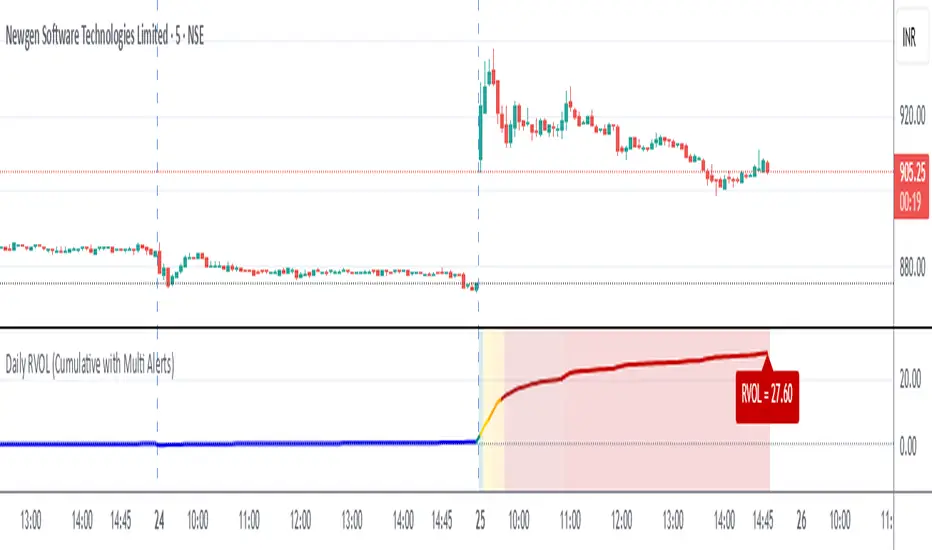
Daily RVOL (Cumulative with Multi Alerts)
This indicator plots Relative Volume (RVOL) on intraday charts by comparing today’s cumulative traded volume with either:
The average daily volume of the past N days (default 5), or
Yesterday’s total daily volume (selectable from settings).
Unlike per-candle RVOL indicators, this version tracks cumulative intraday RVOL that only increases throughout the trading day. This matches how professional scanners (like Chartink/Gocharting) calculate RVOL, e.g. RVOL = 6 at open → 12 → 20 → 45 by end of day.
Protected script
This script is published as closed-source. However, you can use it freely and without any limitations – learn more here.
Disclaimer
The information and publications are not meant to be, and do not constitute, financial, investment, trading, or other types of advice or recommendations supplied or endorsed by TradingView. Read more in the Terms of Use.