PROTECTED SOURCE SCRIPT
M2 + Fed Funds con anotaciones históricas
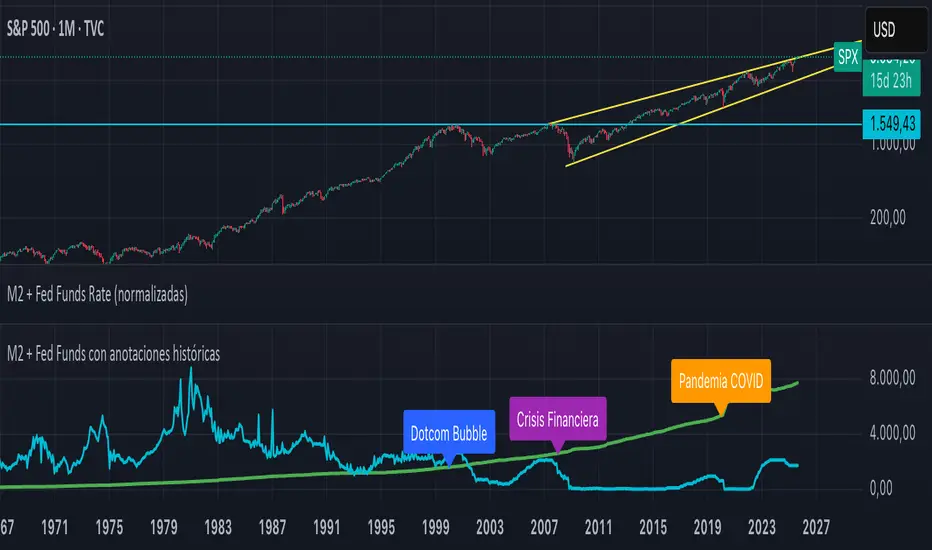
This TradingView indicator creates a separate panel that displays the historical evolution of M2 Money Stock (US) and the Federal Funds Rate, both normalized to a base of 100 for easier comparison. It highlights key historical events with annotations, including:
2000: Dotcom Bubble
2008: Global Financial Crisis
2020: COVID-19 Pandemic
The script allows users to visually analyze the relationship between monetary liquidity (M2) and interest rates, showing how changes in Fed policy correspond to major economic events and trends.
2000: Dotcom Bubble
2008: Global Financial Crisis
2020: COVID-19 Pandemic
The script allows users to visually analyze the relationship between monetary liquidity (M2) and interest rates, showing how changes in Fed policy correspond to major economic events and trends.
Protected script
This script is published as closed-source. However, you can use it freely and without any limitations – learn more here.
Disclaimer
The information and publications are not meant to be, and do not constitute, financial, investment, trading, or other types of advice or recommendations supplied or endorsed by TradingView. Read more in the Terms of Use.