ATH [Moto]
This script attempts to inform trading decisions/sentiment via drawdown (percent) from all time high. Any fan of fibonacci should find this useful.
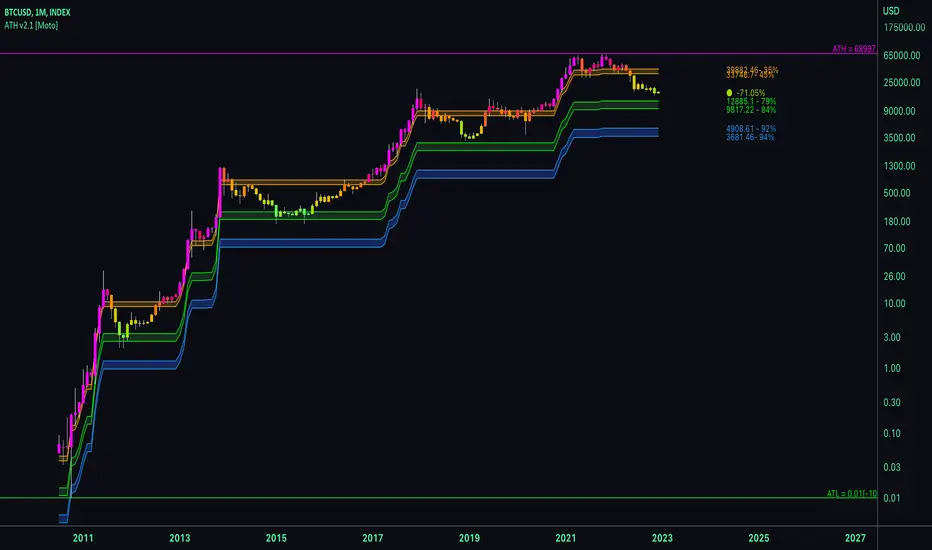
All time high is essentially checked and the script adapts to new/broken all time highs. The plot shapes and signals are based on the candle closes below these common percents from all time high. Use the signals at your own discretion.
Lines and styling are placed at the further extremes of the common % candles. For example, for "Tops", when candles cross under 5% from all time high, and line is made at the candles high, and conversely when a candle crosses above 50% from it's previous all time high a line is placed at its low.
Bar coloring, the % being crossed, and extreme background color are included, as are alerts for each signal.
https://www.tradingview.com/x/MQrMd9Mw/
https://www.tradingview.com/x/ZW5so93g/
https://www.tradingview.com/x/CFL8iWvN/
Invite-only script
Only users approved by the author can access this script. You'll need to request and get permission to use it. This is typically granted after payment. For more details, follow the author's instructions below or contact Intromoto directly.
TradingView does NOT recommend paying for or using a script unless you fully trust its author and understand how it works. You may also find free, open-source alternatives in our community scripts.
Author's instructions
Follow on Twitter for updates.
One time fee, no subscription
twitter.com/IntroMoto
Disclaimer
Invite-only script
Only users approved by the author can access this script. You'll need to request and get permission to use it. This is typically granted after payment. For more details, follow the author's instructions below or contact Intromoto directly.
TradingView does NOT recommend paying for or using a script unless you fully trust its author and understand how it works. You may also find free, open-source alternatives in our community scripts.
Author's instructions
Follow on Twitter for updates.
One time fee, no subscription
twitter.com/IntroMoto