OPEN-SOURCE SCRIPT
Borjas Tarh Horizontals S/R
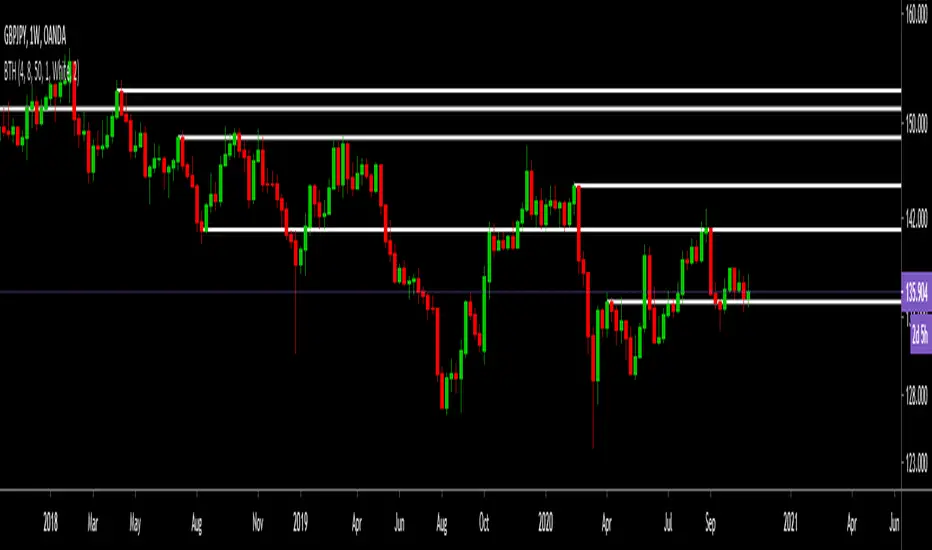
Borjas Tarh Horizontals
Automatically Plot Horizontals Support and Resistance.
In the Setting, you should optimize the values according to each time frame of the ticker.
Pivot Length : Number of bars to use to calculate pivot
Max Breaks : Maximum number of times a line can be broken before it's invalidated
Max Distance % : Maximum distance PA can move away from line before it's invalidated
Frontrun/Overshoot Threshold % : If PA reverses within this distance of an existing S&R line, consider it a Frontrun / Overshoot
You can copy it and make it better.
Open-source script
In true TradingView spirit, the creator of this script has made it open-source, so that traders can review and verify its functionality. Kudos to the author! While you can use it for free, remember that republishing the code is subject to our House Rules.
Disclaimer
The information and publications are not meant to be, and do not constitute, financial, investment, trading, or other types of advice or recommendations supplied or endorsed by TradingView. Read more in the Terms of Use.