OPEN-SOURCE SCRIPT
Updated Pinks MultiRSI
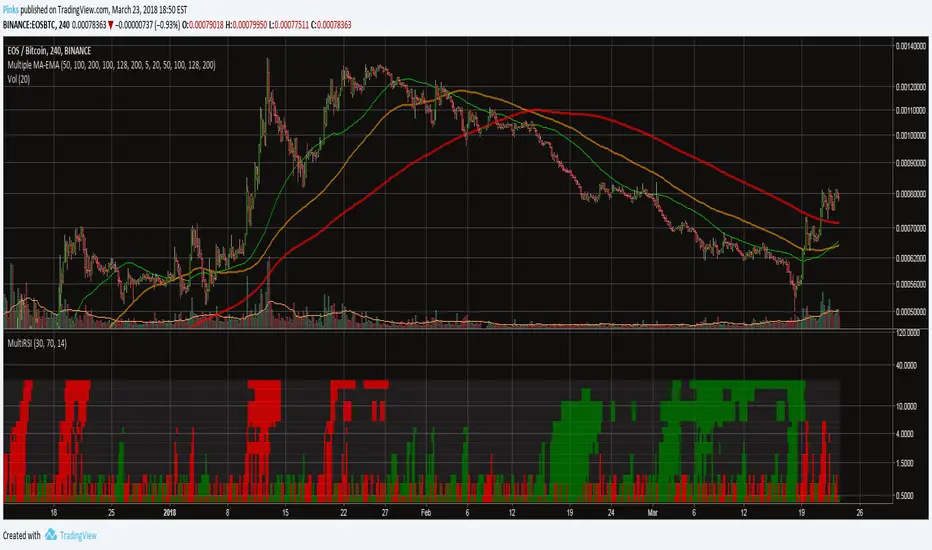
An indicator that displays whether RSI is oversold, undersold, or neutral, on several timeframes:
15m, 30m, 45m, 1h, 2h, 3h, 4h, 5h, 6h, 12h, 18h, 1D.
If RSI for a specific interval is overbought, the bars for that interval turn red (for "sell"). If it is oversold, it turns green (for "buy"). The RSI length, oversold level, and overbought level are tuneable.
The bottom row of coloumns is 15m RSI, top row is 1D RSI. It is recommended to use log scale on this indicator. The bar height is proportional to the interval it cover.
Release Notes
**NEW FEATURES**/b]You can now set multiple levels of overbought and oversold! The columns will be colored according to how oversold or overbought the RSI is. This will help you get a clearer image of the RSI on all timeframes.
Release Notes
Fixed bug where 5h RSI was set to 4h.Release Notes
Changed chart imageOpen-source script
In true TradingView spirit, the creator of this script has made it open-source, so that traders can review and verify its functionality. Kudos to the author! While you can use it for free, remember that republishing the code is subject to our House Rules.
Disclaimer
The information and publications are not meant to be, and do not constitute, financial, investment, trading, or other types of advice or recommendations supplied or endorsed by TradingView. Read more in the Terms of Use.
Open-source script
In true TradingView spirit, the creator of this script has made it open-source, so that traders can review and verify its functionality. Kudos to the author! While you can use it for free, remember that republishing the code is subject to our House Rules.
Disclaimer
The information and publications are not meant to be, and do not constitute, financial, investment, trading, or other types of advice or recommendations supplied or endorsed by TradingView. Read more in the Terms of Use.