OPEN-SOURCE SCRIPT
RSI Simple and Smooth
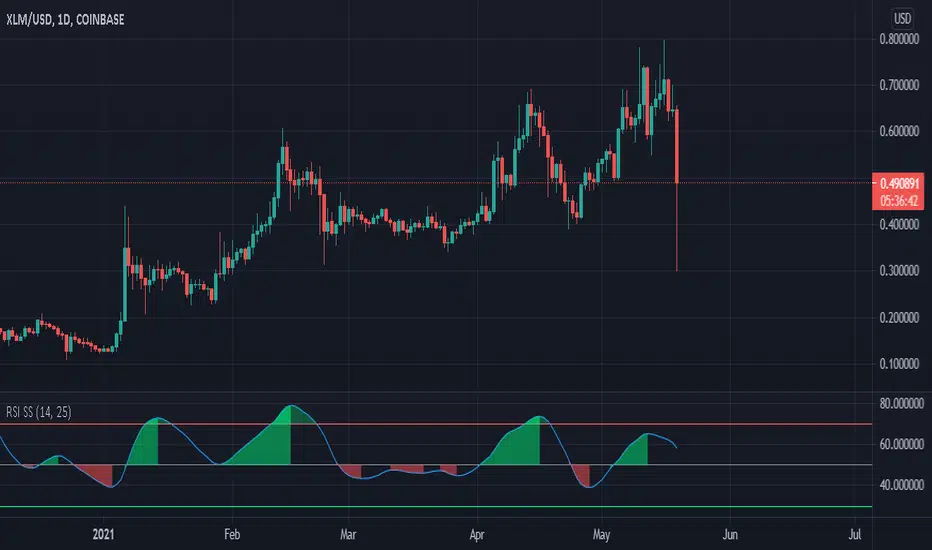
made this RSI for beginners who are annoyed by the jittery signals. Uses a HMA to smooth out the data. I made oversold line green and overbought line red where as the oscillator is green above 50 and red when below 50. This is done intentionally. This is to help remind the user that while there is a downtrend, there is a buy opportunity, and while there is a buy opportunity - there is a downtrend
On the other side, the red overbought line is to remind the user that while there is an uptrend, there is a sell opportunity, and while there is a sell opportunity - there is an uptrend :)
On the other side, the red overbought line is to remind the user that while there is an uptrend, there is a sell opportunity, and while there is a sell opportunity - there is an uptrend :)
Open-source script
In true TradingView spirit, the creator of this script has made it open-source, so that traders can review and verify its functionality. Kudos to the author! While you can use it for free, remember that republishing the code is subject to our House Rules.
Disclaimer
The information and publications are not meant to be, and do not constitute, financial, investment, trading, or other types of advice or recommendations supplied or endorsed by TradingView. Read more in the Terms of Use.