PROTECTED SOURCE SCRIPT
Updated candleswissknife
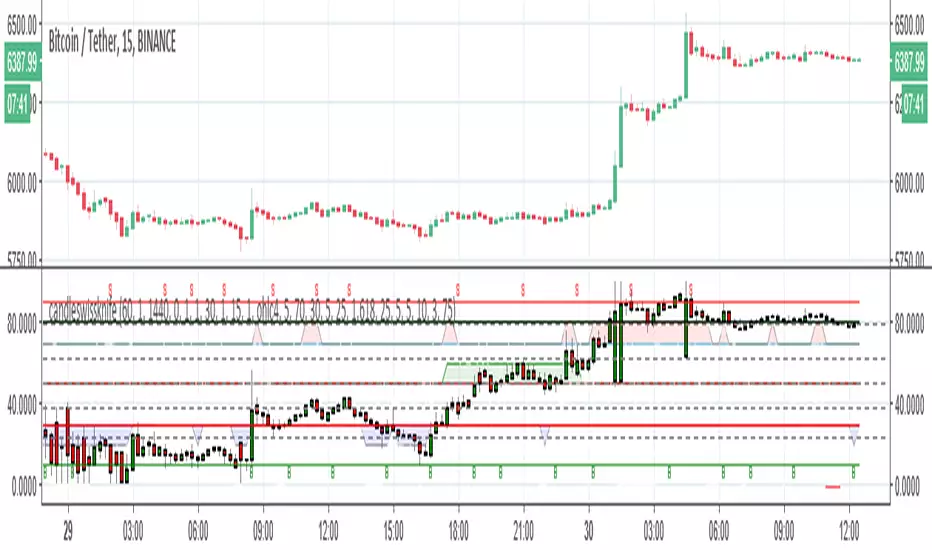
there are two system to buy and sell in this indicator
system 1 is based on long ema and short ema with heiken candle and macd filter (green=buy and red=sell) line bellow the candles)
system 2 is based on fib candle and fast rsi and fast adx crossing (blue=buy line and gray=sell line bellow candle)
B and S are points of stoch rsi crossing
inside there are points of divergence based on ATR and rsi
Release Notes
add color to make it more easy to see + one more buy point that is rsi and candle dependent+ATRsystem is green and lime good strong points of buy.. blue is a potential one
red=sell.. light red you need to think if you want to sell
Release Notes
add alertsRelease Notes
just fix some issue with system 1 buy Release Notes
fix issue with buy point 2Release Notes
just small change in point buy 1Protected script
This script is published as closed-source. However, you can use it freely and without any limitations – learn more here.
Disclaimer
The information and publications are not meant to be, and do not constitute, financial, investment, trading, or other types of advice or recommendations supplied or endorsed by TradingView. Read more in the Terms of Use.
Protected script
This script is published as closed-source. However, you can use it freely and without any limitations – learn more here.
Disclaimer
The information and publications are not meant to be, and do not constitute, financial, investment, trading, or other types of advice or recommendations supplied or endorsed by TradingView. Read more in the Terms of Use.