OPEN-SOURCE SCRIPT
Previous 4H Candle Open and Close Vertical Lines
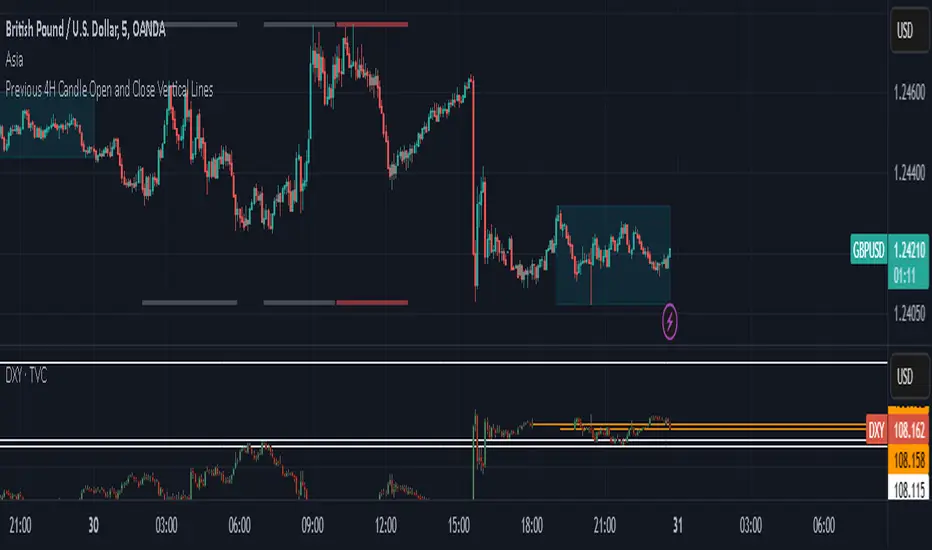
Previous 4H open and close for entry.
This indicator is useful for traders who want to visualize the start and end of the previous 4-hour candle. It can help identify key levels, such as support and resistance, or analyze price action around these times.
Let me know if you need further assistance!
This indicator is useful for traders who want to visualize the start and end of the previous 4-hour candle. It can help identify key levels, such as support and resistance, or analyze price action around these times.
Let me know if you need further assistance!
Open-source script
In true TradingView spirit, the author of this script has published it open-source, so traders can understand and verify it. Cheers to the author! You may use it for free, but reuse of this code in publication is governed by House rules. You can favorite it to use it on a chart.
Want to use this script on a chart?
Disclaimer
The information and publications are not meant to be, and do not constitute, financial, investment, trading, or other types of advice or recommendations supplied or endorsed by TradingView. Read more in the Terms of Use.