Relative Volume - VPA / VSA / Better Volume
Volume is VERY important.
But all the existing methods of volume analysis and order flow analysis fall into the same trap: they're all extremely complicated, hard to learn, and difficult for the human brain to distill down to an actual, tradable signal.
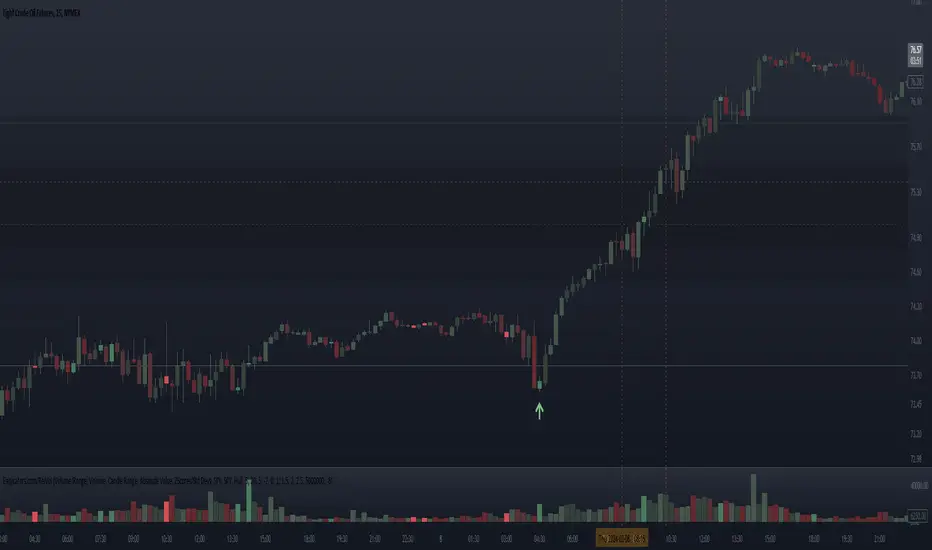
The Relative Volume Gradient Paintbars indicator seeks to address this issue by reducing and simplifying concepts from Volume Price Analaysis (VPA), Volume Spread Analysis (VSA), and Market Profile / Volume Profile into a single indication with varying levels of intensity. Rather than adding more complex symbology and cluttering up your charts with arrows and signals and lines as many volume indicators do, relative volume intuitively takes advantage of the dimension of color, and plays to your brain's automatic recognition of color intensity to highlight areas of interest on a chart where large volumes are being traded. These areas can in turn point out levels of support and resistance, or show strength in a move, exposing the actions of larger market participants that are behind a move.
The Relative Volume indicator can calculate based on a time-segmented / time-based / bar-specific average of volume, adjusting for some of the typical spikes in volume that happen at the beginning and end of a trading day; Or it can be calculated based on any length and type of moving average of volume that is desired: simple, exponential, weighted, Wilders, price-weighted, Hull, or TEMA.
This indicator does more than just normal relative share volume. It can also do relative volume-per-range. The idea behind this setting is that when more volume is being traded but very little movement is happening, this can indicate substantial support or resistance, where a lot of trades are likely being absorbed by larger operators. You can choose your own range calculation for this setting, whether you prefer True Range, high-low range, candle body range, close to close range, or any of several other custom settings.
Moreover, the levels or thresholds at which the color intensity changes are completely user-controlled, so you can adjust them upward to tune out more noise, or downward to increase the level of sensitivity. In addition, all of the colors for each of the thresholds are completely user-controlled.
We hope to see TradingView add support for Richard Arms' CandleVolume or Equivolume before too long, as well as Tick Volume or Trade Count Volume data, all of which can add a lot of power to this method of trading.
- $ Volume
- $ Volume/Range
- $ Volume / Range %
I'd noticed in the past that there were sometimes differences in the highlights between the platforms, but I'd always written it off to slight variations in data sources or something like that.
But I learned there is an actual difference related to how each platform rounds decimal values for the Hull MA: Thinkorswim uses a ceil() function whereas I believe TV uses the floor() function. The descriptions I've seen say it should be rounded as normal, but that doesn't appear to be how these platforms have chosen to calculate it.
So in this update, I've simply provided the user the ability to switch between the 2 styles in the Average Type selector. If you want it to match Thinkorswim or like their version best, you can choose that setting, or you can leave it with the TradingView default method.
Invite-only script
Only users approved by the author can access this script. You'll need to request and get permission to use it. This is typically granted after payment. For more details, follow the author's instructions below or contact easycators directly.
TradingView does NOT recommend paying for or using a script unless you fully trust its author and understand how it works. You may also find free, open-source alternatives in our community scripts.
Author's instructions
Disclaimer
Invite-only script
Only users approved by the author can access this script. You'll need to request and get permission to use it. This is typically granted after payment. For more details, follow the author's instructions below or contact easycators directly.
TradingView does NOT recommend paying for or using a script unless you fully trust its author and understand how it works. You may also find free, open-source alternatives in our community scripts.