OPEN-SOURCE SCRIPT
Updated EGARCH Volatility Estimator

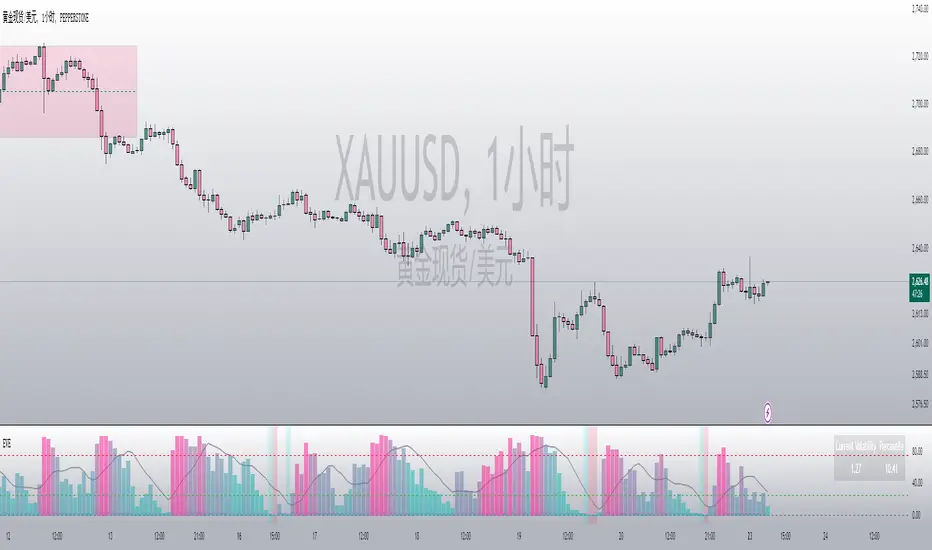
EGARCH Volatility Estimator (EVE)
Overview:
The EGARCH Volatility Estimator (EVE) is a Pine Script indicator designed to quantify market volatility using the Exponential Generalized Autoregressive Conditional Heteroskedasticity (EGARCH) model. This model captures both symmetric and asymmetric volatility dynamics and provides a robust tool for analyzing market risk and trends.
Key Features:
Core EGARCH Formula:
ln(σ t 2 )=ω+α(∣ϵ t−1 ∣+γ⋅ϵ t−1 )+β⋅ln(σ t−1 2 )
ω (Omega): Captures long-term baseline volatility.
α (Alpha): Measures sensitivity to recent shocks.
γ (Gamma): Incorporates asymmetric effects (e.g., higher volatility during market drops).
β (Beta): Reflects the persistence of historical volatility.
The formula computes log-volatility, which is then converted to actual volatility for interpretation.
Standardized Returns:
The script calculates daily log-returns and standardizes them to measure deviations from expected price changes.
Percentile-Based Volatility Analysis:
Tracks the percentile rank of current volatility over a historical lookback period.
Highlights high, medium, or low volatility zones using dynamic background colors.
Dynamic Normalization:
Maps volatility into a normalized range ([0,1]) for better visual interpretation.
Uses color gradients (green to red) to reflect changing volatility levels.
SMA Integration:
Adds a Simple Moving Average (SMA) of either EGARCH volatility or its percentile for trend analysis.
Interactive Display:
Displays current volatility and its percentile rank in a table for quick reference.
Includes high (75%) and low (25%) volatility threshold lines for actionable insights.
Applications:
Market Risk Assessment: Evaluate current and historical volatility to assess market risk levels.
Quantitative Strategy Development: Incorporate volatility dynamics into trading strategies, particularly for options or risk-managed portfolios.
Trend and Momentum Analysis: Use normalized or smoothed volatility trends to identify potential reversals or breakouts.
Asymmetric Volatility Detection: Highlight periods where downside or upside volatility dominates.
Visualization Enhancements:
Dynamic colors and thresholds make it intuitive to interpret market conditions.
Percentile views provide relative volatility context for historical comparison.
This indicator is a versatile tool for traders and analysts seeking deeper insights into market behavior, particularly in volatility-driven trading strategies.
Release Notes
Fixed expression errors and chart display issues,By default, SMA is displayed in percentageOpen-source script
In true TradingView spirit, the creator of this script has made it open-source, so that traders can review and verify its functionality. Kudos to the author! While you can use it for free, remember that republishing the code is subject to our House Rules.
Disclaimer
The information and publications are not meant to be, and do not constitute, financial, investment, trading, or other types of advice or recommendations supplied or endorsed by TradingView. Read more in the Terms of Use.
Open-source script
In true TradingView spirit, the creator of this script has made it open-source, so that traders can review and verify its functionality. Kudos to the author! While you can use it for free, remember that republishing the code is subject to our House Rules.
Disclaimer
The information and publications are not meant to be, and do not constitute, financial, investment, trading, or other types of advice or recommendations supplied or endorsed by TradingView. Read more in the Terms of Use.