OPEN-SOURCE SCRIPT
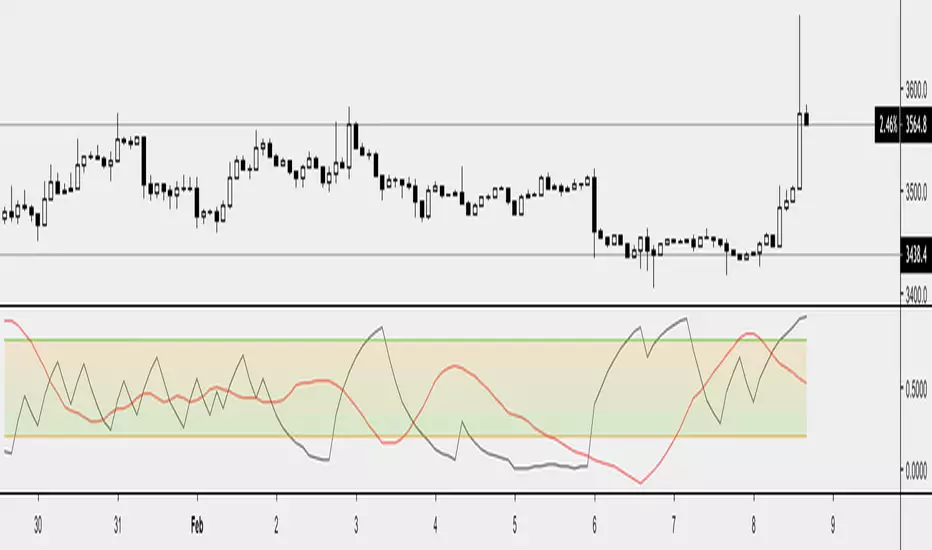
Rogers & Satchell Volatility Estimation

First off, a huge thank you to the following people:
theheirophant: tradingview.com/u/theheirophant/
alexgrover: tradingview.com/u/alexgrover/
NGBaltic: tradingview.com/u/NGBaltic/
The Rogers & Satchell function is a volatility estimator that outperforms other estimators when the underlying follows a geometric Brownian motion with a drift (historical data mean returns different from zero). As a result, it provides a better volatility estimation when the underlying is trending. However, the Rogers & Satchell estimator does not account for jumps in price (gaps). It assumes no opening jump. The function uses the open, close, high, and low price series in its calculation and it has only one parameter, which is the period to use to estimate the volatility.
This script allows you to transform the volatility reading. The intention of this is to be able to compare volatility across different assets and timeframes. Having a relative reading of volatility also allows you to better gauge volatility within the context of current market conditions.
For the signal lie I chose a repulsion moving average to remove choppy crossovers of the estimator and the signal. This may have been a mistake, so in the near-future I might update so that the MA can be selected. Let me know if you have any opinions either way.
Want to Learn?
If you'd like the opportunity to learn Pine but you have difficulty finding resources to guide you, take a look at this rudimentary list: docs.google.com/document/d/10t3ZCQAd2dpdTGPYXDKk2hAM_BQ1Zm80tk0VGHViQc4/edit?usp=sharing
The list will be updated in the future as more people share the resources that have helped, or continue to help, them. Follow me on Twitter to keep up-to-date with the growing list of resources.
Suggestions or Questions?
Don't even kinda hesitate to forward them to me. My (metaphorical) door is always open.
Open-source script
In true TradingView spirit, the creator of this script has made it open-source, so that traders can review and verify its functionality. Kudos to the author! While you can use it for free, remember that republishing the code is subject to our House Rules.
Disclaimer
The information and publications are not meant to be, and do not constitute, financial, investment, trading, or other types of advice or recommendations supplied or endorsed by TradingView. Read more in the Terms of Use.