MBY_Quant_Hercules_Ver.Custom
This is MBY Lab.
We are very excited to deploy Hercules metrics.
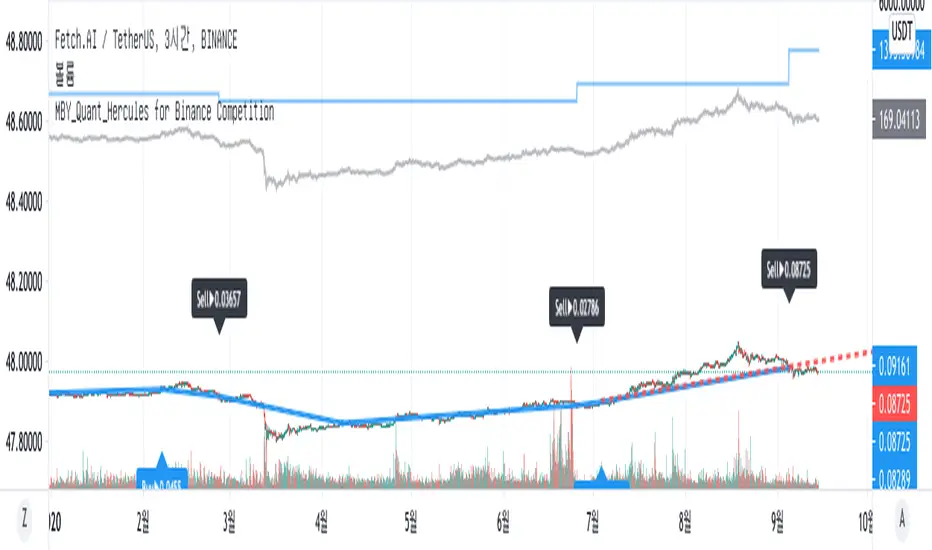
Hercules strategy operates based on the Relative Strength Index , and displays the price when each Relative Strength Index maintains an upward trend or decreases.
When the stock price rises, the price at the time of entering the overbought or oversold section is displayed as the market price, or when the relative strength index falls when the stock price rises, it is captured and the market price is displayed.
Therefore, this indicator is a momentum indicator , and it can be said to be a non-trend following indicator.
The blue line that outputs as blue shows a graph of the asset change when buying or selling at the price pointed to by this indicator, including 0.2% slippage and 0.2% transaction fee.
Of course, this doesn't mean that this metric is always profitable.
This strategy was created to aid trading.
This indicator is a private indicator, please comment if you wish to use it.
And this version is for VSOP
**notice**
"Use the link(Invite only script Contact) below to obtain access to this indicator".
Invite-only script
Only users approved by the author can access this script. You'll need to request and get permission to use it. This is typically granted after payment. For more details, follow the author's instructions below or contact Yonggg92 directly.
TradingView does NOT recommend paying for or using a script unless you fully trust its author and understand how it works. You may also find free, open-source alternatives in our community scripts.
Author's instructions
Disclaimer
Invite-only script
Only users approved by the author can access this script. You'll need to request and get permission to use it. This is typically granted after payment. For more details, follow the author's instructions below or contact Yonggg92 directly.
TradingView does NOT recommend paying for or using a script unless you fully trust its author and understand how it works. You may also find free, open-source alternatives in our community scripts.