PROTECTED SOURCE SCRIPT
Updated structure break indicator
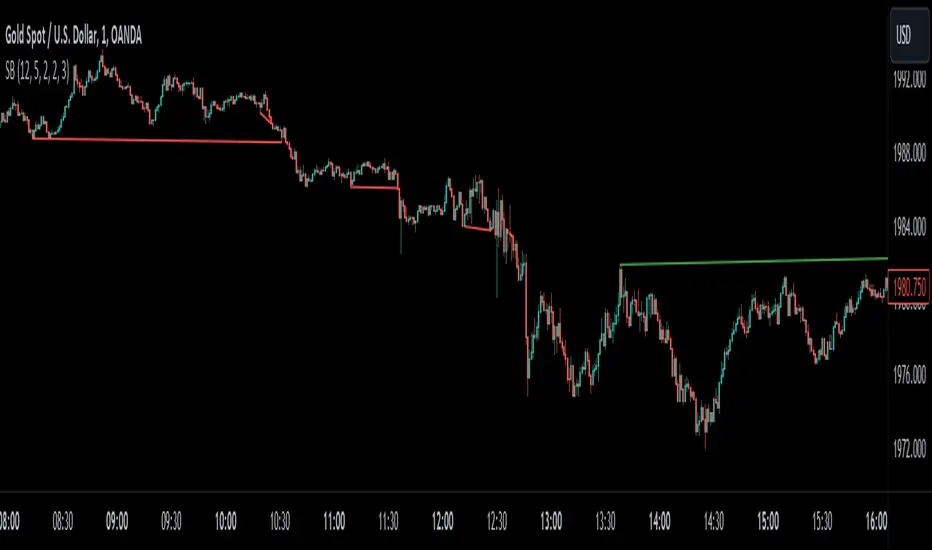
This indicator captures the beginning of a new trend or a correction. If higher highs are formed and the current low breaks the previous low, that means that a downward trend or correction is just beginning. Whereas if there are lower lows and the current high breaks the previous high, an upward trend or correction started. This uses the zigzag indicator made by DevLucem to check if highs and lows are broken or not. In the settings of this indicator you can change the colors of the lines, change the zigzag indicator's settings and choose to see the zigzag lines on your chart. Red colored lines are for bearish breaks and Green colored lines are for bullish breaks.
Release Notes
I changed the colors of the bearish and bullish structure breaks to make it visually easy to see. Red lines signal that a downtrend just started and green lines signal that an uptrend just startedRelease Notes
I changed the settings for the bullish and bearish breaksRelease Notes
I added alerts. The alert for an upward break is "🟢 Bullish break!" and "🔴 Bearish break!" for a downward break.Let me know if you want me to add something else!
Protected script
This script is published as closed-source. However, you can use it freely and without any limitations – learn more here.
Disclaimer
The information and publications are not meant to be, and do not constitute, financial, investment, trading, or other types of advice or recommendations supplied or endorsed by TradingView. Read more in the Terms of Use.