OPEN-SOURCE SCRIPT
Updated Lined Psychological Levels [Dollar and 50 Cents]

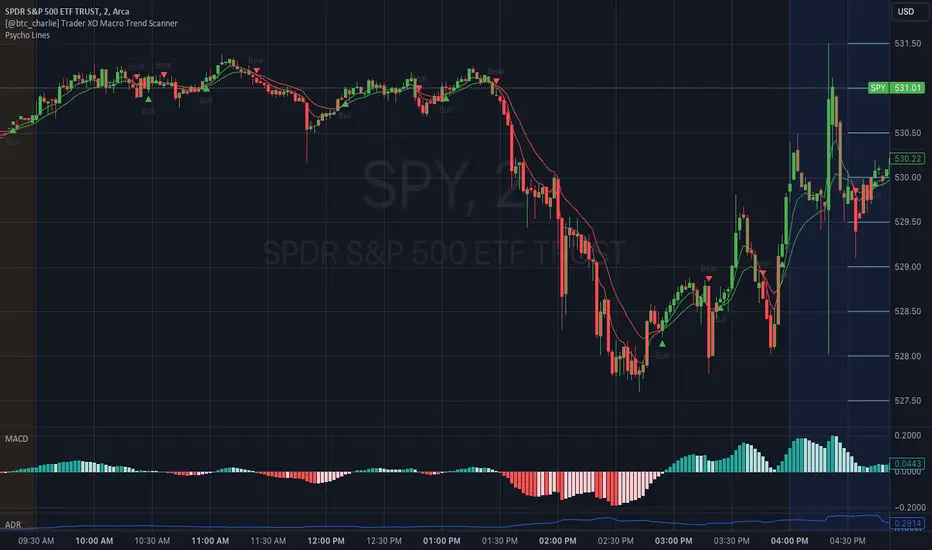
This indicator plots significant psychological price levels at 50 cent and dollar intervals. These levels often act as key support and resistance in the market, as traders tend to place orders around round numbers. By highlighting these levels, traders can easily visualize and potentially anticipate areas of price consolidation or breakout.
Release Notes
This updated version of the "Lined Psychological Levels" script now offers more flexibility by allowing users to set their desired increments for drawing psychological levels on the price chart. This is especially useful for traders who want to adapt the visualization to different market conditions or personal trading strategies.Key Features and Inputs:
Increment Adjustment: Users can now specify the increment value in dollars for the psychological levels, ranging from as small as $0.01. This allows for fine-tuning of the levels according to the asset being traded, much like adjusting one's diet or routine to better suit personal goals or needs.
Number of Levels: Similar to the original script, users can define the number of increments from the current price where the lines should be drawn. This flexibility ensures that traders can focus on more immediate price levels or expand their view to capture larger price movements.
Visual Customization: Inputs for line length, width, and color remain, allowing users to customize the appearance of the lines to better fit the visual style of their chart or to highlight specific levels more prominently.
Calculation and Plotting:
The script calculates the upper and lower bounds for the lines based on the current price, adjusted by the specified increments. This dynamic calculation allows the script to be more responsive to price changes, providing real-time insights into potential psychological barriers or support and resistance levels.
Lines are plotted for every specified increment within these boundaries, ensuring that the chart accurately reflects all relevant levels as defined by the user.
Open-source script
In true TradingView spirit, the creator of this script has made it open-source, so that traders can review and verify its functionality. Kudos to the author! While you can use it for free, remember that republishing the code is subject to our House Rules.
Disclaimer
The information and publications are not meant to be, and do not constitute, financial, investment, trading, or other types of advice or recommendations supplied or endorsed by TradingView. Read more in the Terms of Use.