OPEN-SOURCE SCRIPT
Updated FullPac4Trader (I.Denis)

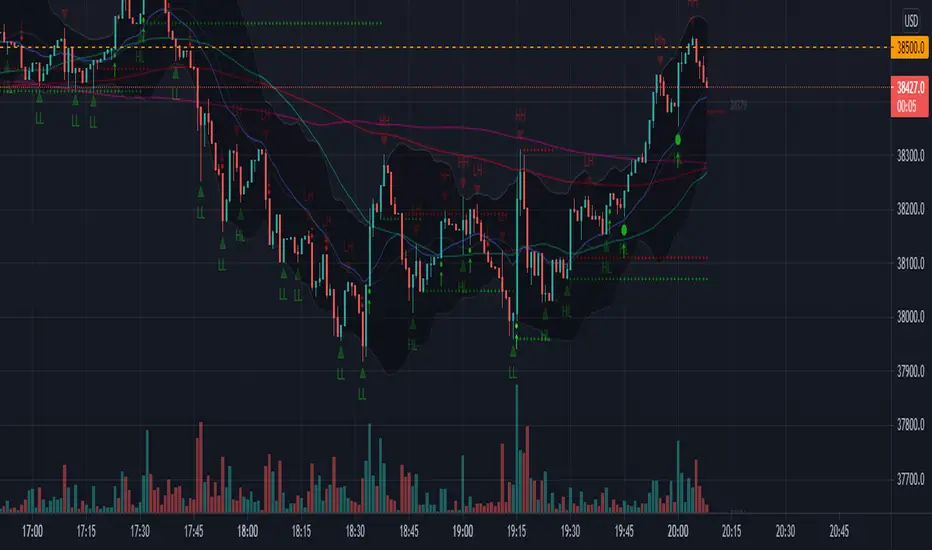
The script combines the three most important indicators on the chart.
1. A set of six moving averages ( EMA and SMA ), which can be turned on and adjusted at your discretion.
2. Indication of support and resistance levels, calculated according to the Bollinger scheme.
3. Pivot Point and the nearest goals using the Floor method with the possibility of selecting a time period.
The script version is v.1 (beta)
The development of this script will continue. Feedback and suggestions are welcome.
Release Notes
Version 2.0The following functions have been added to this version of the script:
1. Calculation of pivot points by Fibonacci levels.
2. Display of the current pivot points next to the last bar.
3. Switch to showing historical pivot points.
4. Indicator of Bollinger bands.
5. Display of reversal bars and their marking.
6. Displaying the Fractal Chaos Channel and marking the breakdown of its boundaries.
Release Notes
Version 2.1The following functions have been added to this version of the script:
1. Added the ability to put an alert on the intersection of Channels of Chaos - BUY! and SELL!
2. Added an indication of the current period on the Pivot Points level labels.
Release Notes
v.2.2 - Fixed an error when plotting the historical chart of pivot point levels.Open-source script
In true TradingView spirit, the creator of this script has made it open-source, so that traders can review and verify its functionality. Kudos to the author! While you can use it for free, remember that republishing the code is subject to our House Rules.
Disclaimer
The information and publications are not meant to be, and do not constitute, financial, investment, trading, or other types of advice or recommendations supplied or endorsed by TradingView. Read more in the Terms of Use.
Open-source script
In true TradingView spirit, the creator of this script has made it open-source, so that traders can review and verify its functionality. Kudos to the author! While you can use it for free, remember that republishing the code is subject to our House Rules.
Disclaimer
The information and publications are not meant to be, and do not constitute, financial, investment, trading, or other types of advice or recommendations supplied or endorsed by TradingView. Read more in the Terms of Use.