OPEN-SOURCE SCRIPT
Updated Cash Flow Yields
Cash Flow Yields Indicator
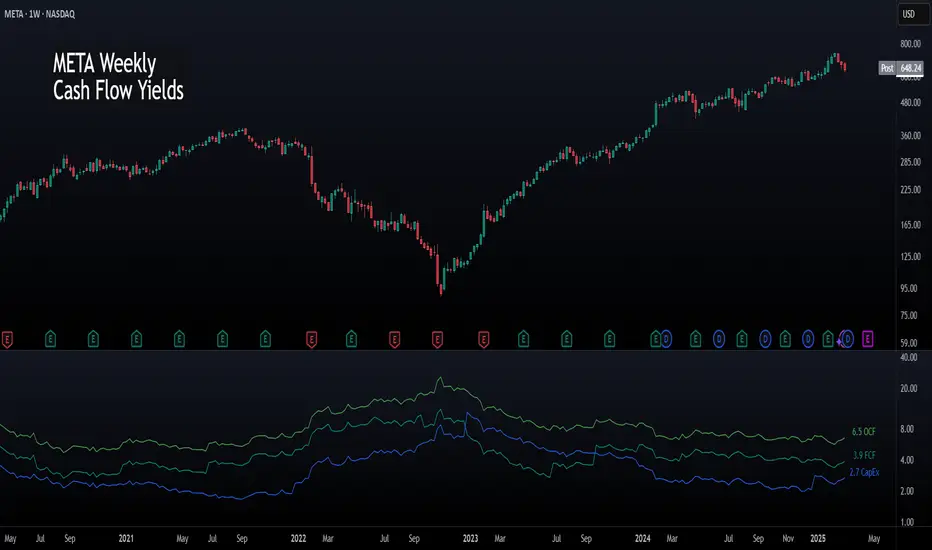
This indicator offers a straightforward way to visualize a company’s cash flow metrics—Free Cash Flow (FCF), Operating Cash Flow (OCF), and Capital Expenditures (CapEx)—as yields relative to its market capitalization. With the flexibility to switch between Trailing Twelve Months (TTM) and Quarterly data, it’s perfect for spotting financial efficiency trends at a glance. Values are plotted as dynamic lines with smart color coding and labeled for clarity.
Features:
To use it, add it to your chart and toggle between TTM or Quarterly to see trends. FCF should roughly equal OCF minus CapEx. Adjust your view to focus on companies with strong FCF yields for potential opportunities.
This indicator is freely available and open-source on TradingView for everyone to use. Enjoy!
This indicator offers a straightforward way to visualize a company’s cash flow metrics—Free Cash Flow (FCF), Operating Cash Flow (OCF), and Capital Expenditures (CapEx)—as yields relative to its market capitalization. With the flexibility to switch between Trailing Twelve Months (TTM) and Quarterly data, it’s perfect for spotting financial efficiency trends at a glance. Values are plotted as dynamic lines with smart color coding and labeled for clarity.
Features:
- TTM & Quarterly Data: Toggle between financial periods to suit your analysis.
- Color-Coded Lines: Green for positive OCF, teal for positive FCF, and blue for CapEx. Red and maroon kick in when values turn negative.
- Yield Perspective: See FCF, OCF, and CapEx as percentages of market cap, making it easy to compare cash flow strength across companies.
- Clear Labels: The latest values pop up on the chart, positioned to the right of the last bar.
- Simple & Intuitive: No clutter - just clean lines and numbers to help you focus on what matters.
To use it, add it to your chart and toggle between TTM or Quarterly to see trends. FCF should roughly equal OCF minus CapEx. Adjust your view to focus on companies with strong FCF yields for potential opportunities.
This indicator is freely available and open-source on TradingView for everyone to use. Enjoy!
Release Notes
Minor formatting updatesRelease Notes
Minor formatting updateOpen-source script
In true TradingView spirit, the creator of this script has made it open-source, so that traders can review and verify its functionality. Kudos to the author! While you can use it for free, remember that republishing the code is subject to our House Rules.
Disclaimer
The information and publications are not meant to be, and do not constitute, financial, investment, trading, or other types of advice or recommendations supplied or endorsed by TradingView. Read more in the Terms of Use.
Open-source script
In true TradingView spirit, the creator of this script has made it open-source, so that traders can review and verify its functionality. Kudos to the author! While you can use it for free, remember that republishing the code is subject to our House Rules.
Disclaimer
The information and publications are not meant to be, and do not constitute, financial, investment, trading, or other types of advice or recommendations supplied or endorsed by TradingView. Read more in the Terms of Use.