PROTECTED SOURCE SCRIPT
Manual Vertical Lines (ramlakshman das)
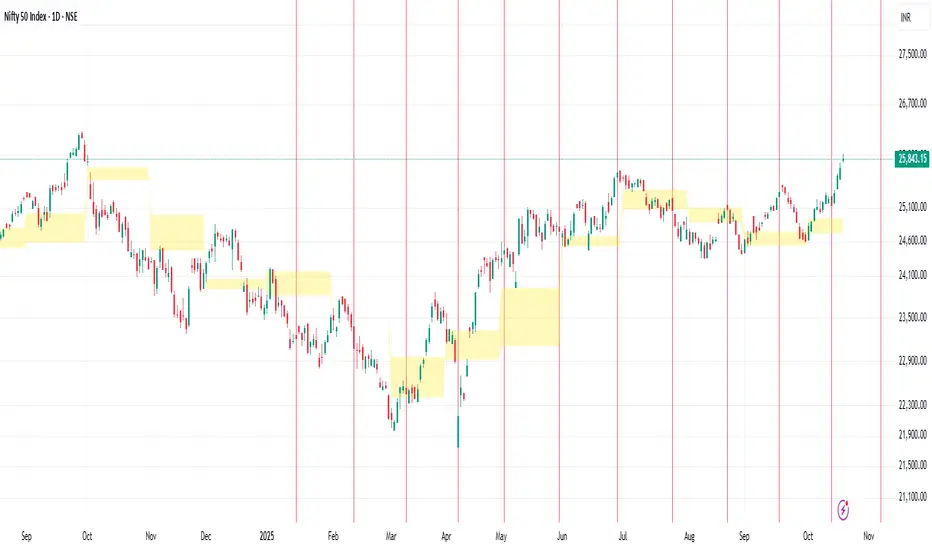
This script is useful for traders who want to visually mark important past or upcoming events such as earnings announcements, market opens/closes, or economic dates directly on their price charts. Its manual input format offers maximal customization for each individual line without loops, making it straightforward to fine-tune each line’s parameters individually.
Key features include:
Manual control over up to multiple vertical lines.
Support for any date and time with precise timestamp inputs.
Customizable line colors.
Persistence of lines into the future.
Clear, user-friendly input naming for ease of use.
This indicator helps traders visually track crucial dates and prepare for events by highlighting them on their charts, improving decision-making and situational awareness during trading.
Protected script
This script is published as closed-source. However, you can use it freely and without any limitations – learn more here.
Disclaimer
The information and publications are not meant to be, and do not constitute, financial, investment, trading, or other types of advice or recommendations supplied or endorsed by TradingView. Read more in the Terms of Use.