OPEN-SOURCE SCRIPT
Updated TRI - Quick Analysis
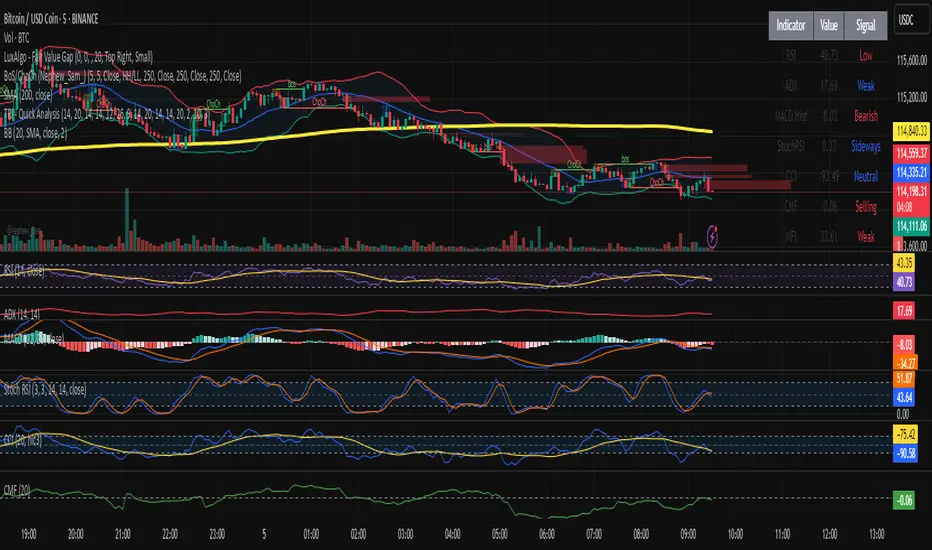
"TRI - Quick Analysis" is a multi-indicator dashboard designed to give traders an immediate overview of market momentum, trend strength, volume flow, and volatility.
It visually summarizes key technical indicators in a compact table, including:
Each value is color-coded (green, red, blue) based on whether it's favorable, unfavorable, or neutral for a potential long position.
At the bottom of the table, a summary score dynamically aggregates signals from all indicators and provides a simple trading score.
This tool is designed for discretionary traders looking for a quick, color-coded insight into current market conditions without relying on a single signal.
It visually summarizes key technical indicators in a compact table, including:
- RSI (momentum)
- MACD Histogram (trend momentum)
- ADX + SuperTrend (trend strength & direction)
- StochRSI (oversold/overbought)
- CCI (price deviation)
- CMF (volume flow)
- MFI (volume-weighted momentum)
- OBV (cumulative volume pressure)
- ATR (volatility)
- %B Bollinger (position within Bollinger Bands)
Each value is color-coded (green, red, blue) based on whether it's favorable, unfavorable, or neutral for a potential long position.
At the bottom of the table, a summary score dynamically aggregates signals from all indicators and provides a simple trading score.
This tool is designed for discretionary traders looking for a quick, color-coded insight into current market conditions without relying on a single signal.
Release Notes
TRI - Quick Analysis is a multi-indicator dashboard designed to give traders an immediate overview of market momentum, trend strength, volume flow, and volatility.It visually summarizes key technical indicators in a compact table, including:
- RSI (momentum)
- MACD Histogram (trend momentum)
- ADX + SuperTrend (trend strength & direction)
- StochRSI (oversold/overbought)
- CCI (price deviation)
- CMF (volume flow)
- MFI (volume-weighted momentum)
- OBV (cumulative volume pressure)
- ATR (volatility)
- %B Bollinger (position within Bollinger Bands)
Each value is color-coded (green, red, blue) based on whether it's favorable, unfavorable, or neutral for a potential long position.
At the bottom of the table, a summary score dynamically aggregates signals from all indicators and provides a simple trading score.
This tool is designed for discretionary traders looking for a quick, color-coded insight into current market conditions without relying on a single signal.
Open-source script
In true TradingView spirit, the creator of this script has made it open-source, so that traders can review and verify its functionality. Kudos to the author! While you can use it for free, remember that republishing the code is subject to our House Rules.
Disclaimer
The information and publications are not meant to be, and do not constitute, financial, investment, trading, or other types of advice or recommendations supplied or endorsed by TradingView. Read more in the Terms of Use.