OPEN-SOURCE SCRIPT
Sell Relative Strength Index [ChuckBanger]
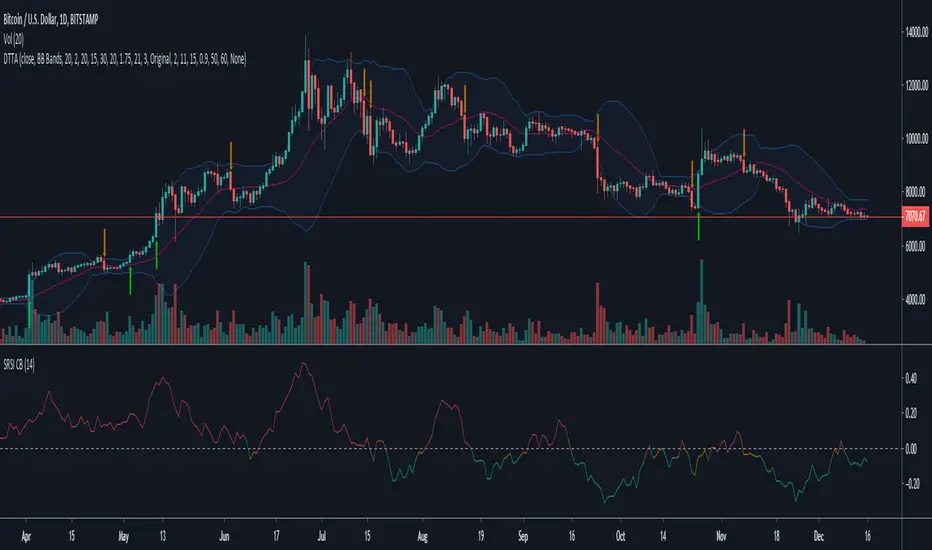
This is Sell Relative Strength Index (SRSI or “sell gravitation index”). This indicator was developed by Howard Wand as featured in the February 2019 issue of TASC magazine.
"Traders accumulate profits trade by trade, with the goal of maximizing profits. But selloffs happen and when they do, you see significant price drops that are fast. Here’s an indicator that uses the profit accumulation size to estimate subsequent selloff size.
Green lines represent buy, red represents sell and yellow represents a balance between buy and sell signals on the SRSI."
Open-source script
In true TradingView spirit, the creator of this script has made it open-source, so that traders can review and verify its functionality. Kudos to the author! While you can use it for free, remember that republishing the code is subject to our House Rules.
Tip jar, if you want to support my indicators work
BTC: 3EV8QGKK689kToo1r8pZJXbWDqzyJQtHy6
LTC: LRAikFVtnqY2ScJUR2ETJSG4w9t8LcmSdh
BTC: 3EV8QGKK689kToo1r8pZJXbWDqzyJQtHy6
LTC: LRAikFVtnqY2ScJUR2ETJSG4w9t8LcmSdh
Disclaimer
The information and publications are not meant to be, and do not constitute, financial, investment, trading, or other types of advice or recommendations supplied or endorsed by TradingView. Read more in the Terms of Use.