PROTECTED SOURCE SCRIPT
Bar%Change
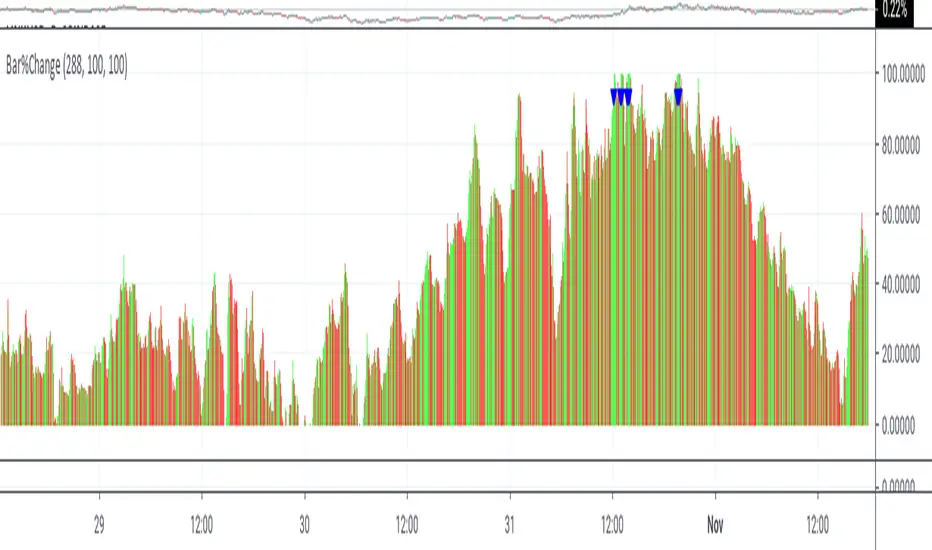
This is a visual study to hilight the change is candlestick by percentage. the percentages are calculated by the duration of the momentum. This study is not designed for automated trading.
The triangles show buys/sells on the basis of momentum. Buys occur below momentum, while sells occur above.
Percentages are shown in red if closing less then opening or closing less then previous closing, otherwise green.
Buying and selling changes in candlestick percentages are user configurable.
The triangles show buys/sells on the basis of momentum. Buys occur below momentum, while sells occur above.
Percentages are shown in red if closing less then opening or closing less then previous closing, otherwise green.
Buying and selling changes in candlestick percentages are user configurable.
Protected script
This script is published as closed-source. However, you can use it freely and without any limitations – learn more here.
Join my Patreon for exclusive access to Jackrabbit TV,
patreon.com/RD3277
patreon.com/RD3277
Disclaimer
The information and publications are not meant to be, and do not constitute, financial, investment, trading, or other types of advice or recommendations supplied or endorsed by TradingView. Read more in the Terms of Use.