OPEN-SOURCE SCRIPT
Volume Outlier Signal Detector (Based on IQR)
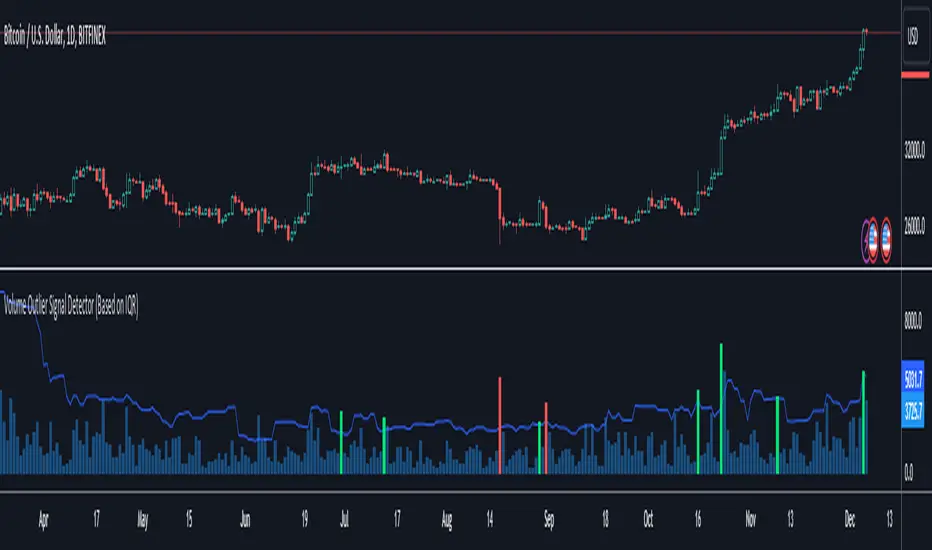
This indicator can detect outliers in trading volume using the 1.5 IQR rule or the outlier formula.
The outlier formula designates outliers based on upper and lower boundaries. Any value that is 1.5 times the Interquartile Range (IQR) greater than the third quartile is designated as an outlier.
The indicator computes the Q3 (75th percentile) and Q1 (25th percentile) of a given volume dataset. The IQR is then calculated by subtracting the Q1 volume from the Q3 volume.
To identify volume outliers, the indicator uses the formula:
Q3 Volume + IQR Multiplier(1.5) * IQR

If the trading volume surpasses the volume outlier, the indicator will display either a green or red column.
A green column indicates that the current bar volume is higher than the volume outlier, and simultaneously, the current bar close is higher than the previous bar's close. Vice versa for the red column.
Moving averages are an optional parameter that can be added to filter out instances where the indicator shows a green or red column. If this option is enabled, the indicator will not display a green column if the price is not above the moving average, and vice versa for red columns.
Several settings can be customized to personalize this indicator, such as setting the moving average filter to higher timeframes. The MA type can also be switched, and IQR settings can be adjusted to fit different markets.
This indicator only works with TradingView charts with volume data.
***Disclaimer:
Before using this indicator for actual trading, make sure to conduct a back test to ensure the strategy is not a losing one in the long run. Apply proper risk management techniques, such as position sizing and using stop loss.
The outlier formula designates outliers based on upper and lower boundaries. Any value that is 1.5 times the Interquartile Range (IQR) greater than the third quartile is designated as an outlier.
The indicator computes the Q3 (75th percentile) and Q1 (25th percentile) of a given volume dataset. The IQR is then calculated by subtracting the Q1 volume from the Q3 volume.
To identify volume outliers, the indicator uses the formula:
Q3 Volume + IQR Multiplier(1.5) * IQR
If the trading volume surpasses the volume outlier, the indicator will display either a green or red column.
A green column indicates that the current bar volume is higher than the volume outlier, and simultaneously, the current bar close is higher than the previous bar's close. Vice versa for the red column.
Moving averages are an optional parameter that can be added to filter out instances where the indicator shows a green or red column. If this option is enabled, the indicator will not display a green column if the price is not above the moving average, and vice versa for red columns.
Several settings can be customized to personalize this indicator, such as setting the moving average filter to higher timeframes. The MA type can also be switched, and IQR settings can be adjusted to fit different markets.
This indicator only works with TradingView charts with volume data.
***Disclaimer:
Before using this indicator for actual trading, make sure to conduct a back test to ensure the strategy is not a losing one in the long run. Apply proper risk management techniques, such as position sizing and using stop loss.
Open-source script
In true TradingView spirit, the creator of this script has made it open-source, so that traders can review and verify its functionality. Kudos to the author! While you can use it for free, remember that republishing the code is subject to our House Rules.
Disclaimer
The information and publications are not meant to be, and do not constitute, financial, investment, trading, or other types of advice or recommendations supplied or endorsed by TradingView. Read more in the Terms of Use.