OPEN-SOURCE SCRIPT
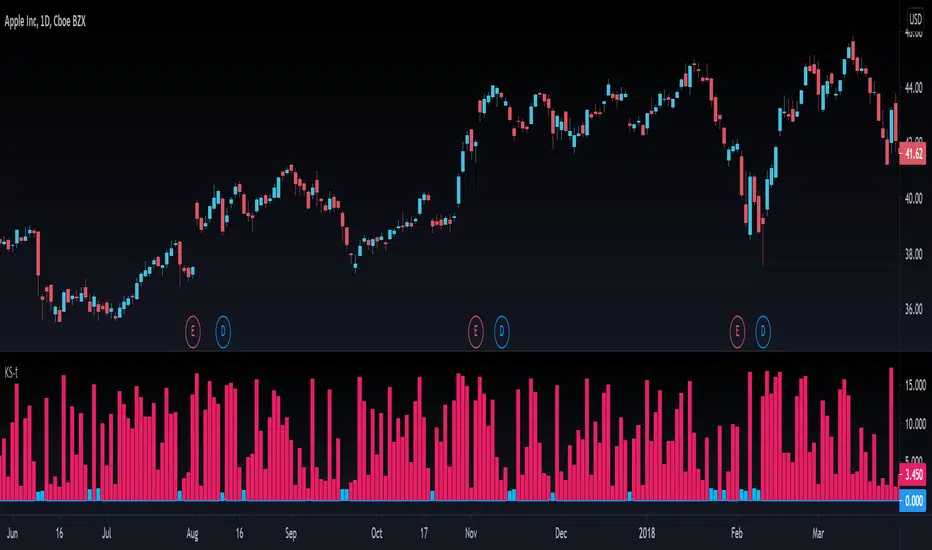
Kolmogorov-Smirnov Test

The Kolmogorov–Smirnov test aims to tell you if the distribution of prices (or log returns) tends to follow a normal distribution or not. You can read about this test on Wikipedia. It seems to be a basic but trusted measure in the quantitative trading world.
When KS-t columns are blue, then it's safe to assume normal distribution. When they are red, the normal distribution assumption is proven wrong by the magnitude of the KS-t value.
In the plotting tab of the script, you can activate another option that displays the probability of the distribution being actually normal. It's values are bounded between 0 and 1, like all probabilities.
This test can be useful when using statistical concepts for trading markets, like standard deviations, z-scores, etc because they all depend on the assumption of prices (or log returns) being normaly distributed.
If you see something wrong, don't hesitate to message me.
Happy trading to all.
Open-source script
In true TradingView spirit, the creator of this script has made it open-source, so that traders can review and verify its functionality. Kudos to the author! While you can use it for free, remember that republishing the code is subject to our House Rules.
Disclaimer
The information and publications are not meant to be, and do not constitute, financial, investment, trading, or other types of advice or recommendations supplied or endorsed by TradingView. Read more in the Terms of Use.