OPEN-SOURCE SCRIPT
Overextended vs 50DMA Detector
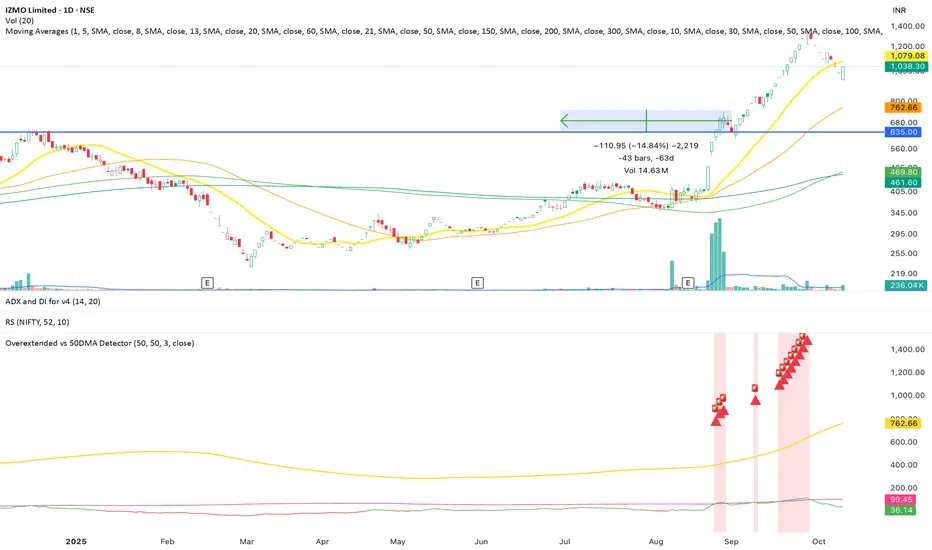
This indicator helps traders identify when a stock or asset becomes statistically overextended relative to its 50-day moving average (50DMA) — a key signal for potential pullbacks, consolidations, or profit-taking zones.
⸻
🔍 What It Does
• Calculates the 50-day simple moving average (SMA) of price.
• Computes the percentage gap between current price and the 50DMA.
• Measures the standard deviation of that percentage gap to assess volatility-adjusted extremes.
• Flags the stock as “Overextended” when:
• Price is more than 20% above the 50DMA, and
• The % gap is greater than 3× its historical standard deviation.
When these conditions are met, the script:
• Highlights the candle with a 🚨 red triangle on the chart.
• Shades the background to indicate potential overheating.
• Triggers an alert condition so traders can be notified in real time.
Open-source script
In true TradingView spirit, the creator of this script has made it open-source, so that traders can review and verify its functionality. Kudos to the author! While you can use it for free, remember that republishing the code is subject to our House Rules.
Disclaimer
The information and publications are not meant to be, and do not constitute, financial, investment, trading, or other types of advice or recommendations supplied or endorsed by TradingView. Read more in the Terms of Use.