Key Levels with RTH-Only Lines and End-of-Line Labels
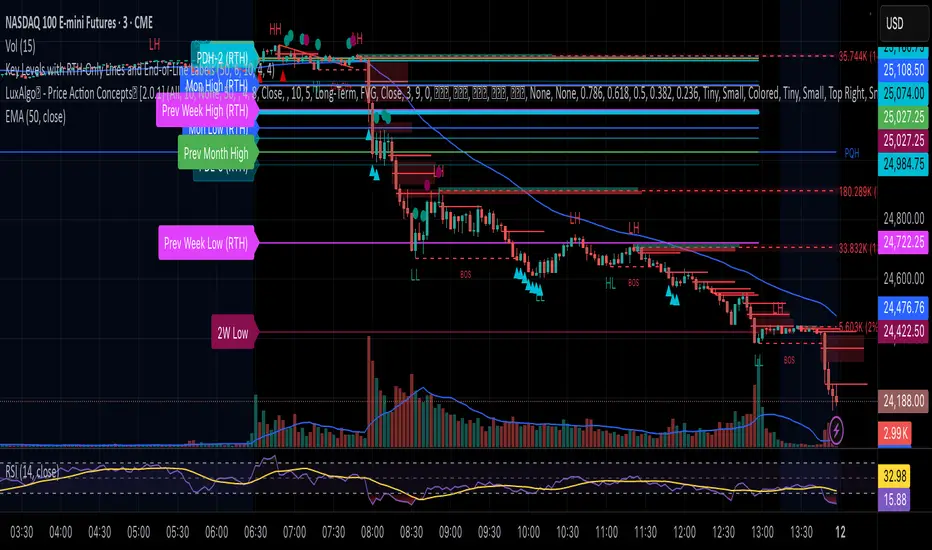
Each level is automatically updated based on session data and is visually extended across the current trading day using line breaks (plot.style_linebr). At the start of each RTH session, the script also places end-of-line labels identifying each level (e.g., PDH, PDL, Mon High, Mon Low, Weekly High/Low, Monthly High/Low), allowing traders to quickly reference key zones without clutter.
This tool is ideal for:
Futures and equity traders who rely on session-based support and resistance levels.
Identifying reaction points where liquidity often builds — such as prior highs/lows or weekly extremes.
Maintaining focus on live market structure while avoiding noise from premarket or overnight price action.
Additional features:
All levels and labels are plotted only during RTH for visual clarity.
Supports custom labeling and alert logic extensions for breakout or retest strategies.
Built with scalability in mind — works across different symbols and timeframes.
Invite-only script
Only users approved by the author can access this script. You'll need to request and get permission to use it. This is typically granted after payment. For more details, follow the author's instructions below or contact govind220 directly.
TradingView does NOT recommend paying for or using a script unless you fully trust its author and understand how it works. You may also find free, open-source alternatives in our community scripts.
Author's instructions
Disclaimer
Invite-only script
Only users approved by the author can access this script. You'll need to request and get permission to use it. This is typically granted after payment. For more details, follow the author's instructions below or contact govind220 directly.
TradingView does NOT recommend paying for or using a script unless you fully trust its author and understand how it works. You may also find free, open-source alternatives in our community scripts.