OPEN-SOURCE SCRIPT
Updated F.B_Consolidation Range Identifier

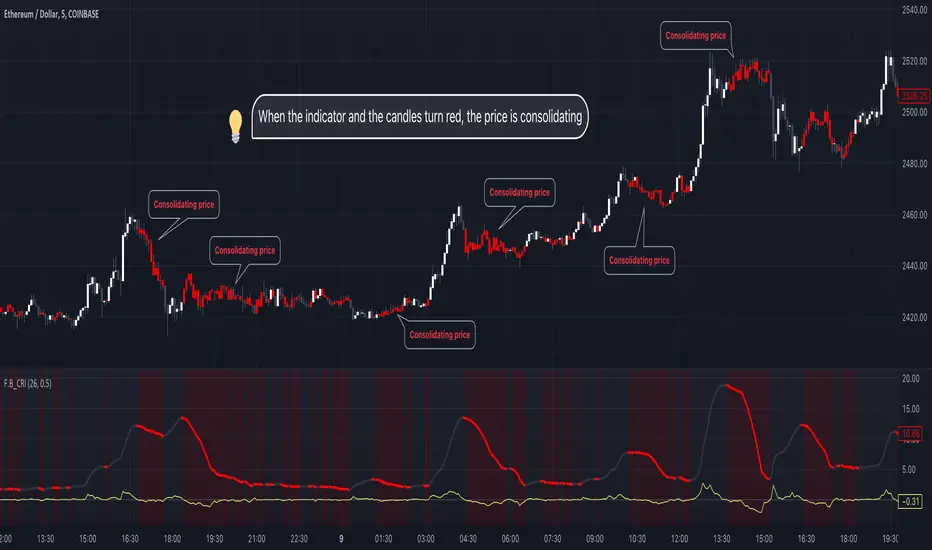
The "F.B_Consolidation Range Identifier" (F.B_CRI) is an indicator aimed at identifying consolidation areas in the price chart. Here is an explanation of the logic and usage of this indicator:
Calculation of Standard Deviation
This indicator analyzes the market's volatility by considering the standard deviation of price movements over a defined period. A higher standard deviation indicates larger price movement, while a lower standard deviation suggests potential consolidation, where price movements are limited.
Derivation of Standard Deviation
To track changes in volatility, the derivative of the standard deviation is calculated. Positive derivative values indicate increasing volatility, while negative values suggest a decrease in volatility. This allows for the identification of potential consolidation phases where volatility decreases, and the market may stabilize.
Identification of Consolidation Phase
The indicator signals potential consolidation phases when the standard deviation is low and/or the derivative of the standard deviation is negative. To represent consolidation phases on the chart, the standard deviation line, background, and candles are colored red. However, it's important to note that the display is customizable and can be configured according to individual needs.
🚨 Important 🚨
The indicator only indicates whether consolidation phases exist. If the standard deviation line, background, or candles are gray, it indicates that a trend exists in general, but not whether it is bullish or bearish. It is advisable to use other analytical tools to confirm the direction of the trend.
Release Notes
Timeframe selection in settingsOpen-source script
In true TradingView spirit, the creator of this script has made it open-source, so that traders can review and verify its functionality. Kudos to the author! While you can use it for free, remember that republishing the code is subject to our House Rules.
Disclaimer
The information and publications are not meant to be, and do not constitute, financial, investment, trading, or other types of advice or recommendations supplied or endorsed by TradingView. Read more in the Terms of Use.
Open-source script
In true TradingView spirit, the creator of this script has made it open-source, so that traders can review and verify its functionality. Kudos to the author! While you can use it for free, remember that republishing the code is subject to our House Rules.
Disclaimer
The information and publications are not meant to be, and do not constitute, financial, investment, trading, or other types of advice or recommendations supplied or endorsed by TradingView. Read more in the Terms of Use.