OPEN-SOURCE SCRIPT
Anand Bollinger Bands - Linear Regression Slope
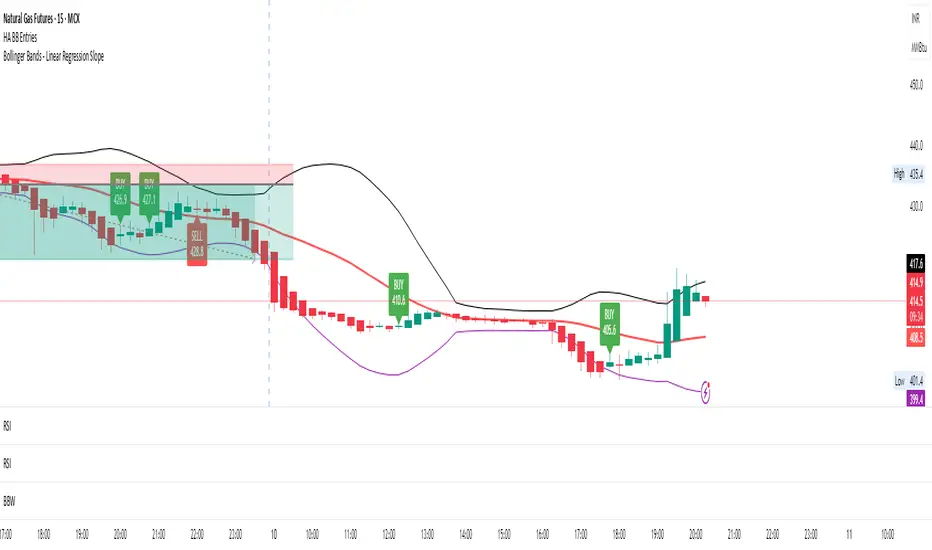
Summary
Bollinger Bands show price volatility using SMA ± standard deviation
Linear Regression calculates the mathematical trend through the middle line
Slope comparison (current vs. previous) determines if trend is rising or falling
Color changes based on that trend: Green = up, Red = down
Uses same period for both BB and slope = everything stays synchronized
The result: A visual indicator that shows you not just where price is relative to volatility, but also which direction the trend is actually moving!
Open-source script
In true TradingView spirit, the creator of this script has made it open-source, so that traders can review and verify its functionality. Kudos to the author! While you can use it for free, remember that republishing the code is subject to our House Rules.
Disclaimer
The information and publications are not meant to be, and do not constitute, financial, investment, trading, or other types of advice or recommendations supplied or endorsed by TradingView. Read more in the Terms of Use.