OPEN-SOURCE SCRIPT
Updated Brown's Exponential Smoothing (BES)
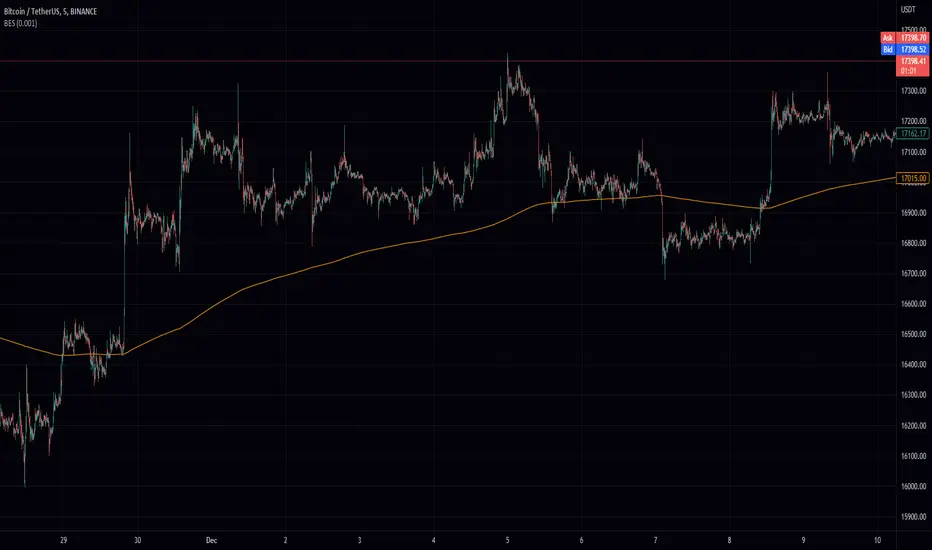
The Brown's Exponential Smoothing indicator is a smoothing function that uses an exponentially weighted moving average to filter the input data. The "alpha" parameter controls the degree of smoothing, with a smaller value resulting in more smoothing and a larger value resulting in less smoothing.
The indicator is implemented as a function, bes, which takes two arguments: source and alpha. The source argument specifies the input data to be smoothed, and the alpha argument specifies the degree of smoothing. The default value for alpha is 0.7, but it can be modified by the user using an input field.
The bes function calculates a smoothed value using the current value of the input data and the previously calculated smoothed value, and updates the value of the smoothed data. This process is repeated for each data point in the input data, resulting in a smoothed version of the data.
The resulting smoothed data is then plotted on the chart using the plot function.
The "BES" indicator can be useful for smoothing noisy or volatile data and making trends in the data more discernible. It may be particularly useful in situations where the input data is highly variable or difficult to interpret due to noise. By adjusting the value of the alpha parameter, the user can control the degree of smoothing applied to the data, allowing them to tailor the indicator to their specific needs and preferences.
Release Notes
bug fixRelease Notes
minor fixOpen-source script
In true TradingView spirit, the creator of this script has made it open-source, so that traders can review and verify its functionality. Kudos to the author! While you can use it for free, remember that republishing the code is subject to our House Rules.
Disclaimer
The information and publications are not meant to be, and do not constitute, financial, investment, trading, or other types of advice or recommendations supplied or endorsed by TradingView. Read more in the Terms of Use.
Open-source script
In true TradingView spirit, the creator of this script has made it open-source, so that traders can review and verify its functionality. Kudos to the author! While you can use it for free, remember that republishing the code is subject to our House Rules.
Disclaimer
The information and publications are not meant to be, and do not constitute, financial, investment, trading, or other types of advice or recommendations supplied or endorsed by TradingView. Read more in the Terms of Use.