OPEN-SOURCE SCRIPT
Updated SuperIchi Strategy

TRADE CONDITIONS
Long entry:
Short entry:
Risk management:
Each trade risks 2% of account (configurable in settings)
SL size determined by swing low/high of previous X candles (configurable in settings) or using the ATR override (configurable in settings) where the max of swing high/low or ATR value will be used to calculate SL
TP is calculated by Risk:Reward ratio (configurable in settings)
TIPS
Timeframe: I have found best results running on anything 5M and above
CREDITS
SuperIchi [LUX] by LuxAlgo
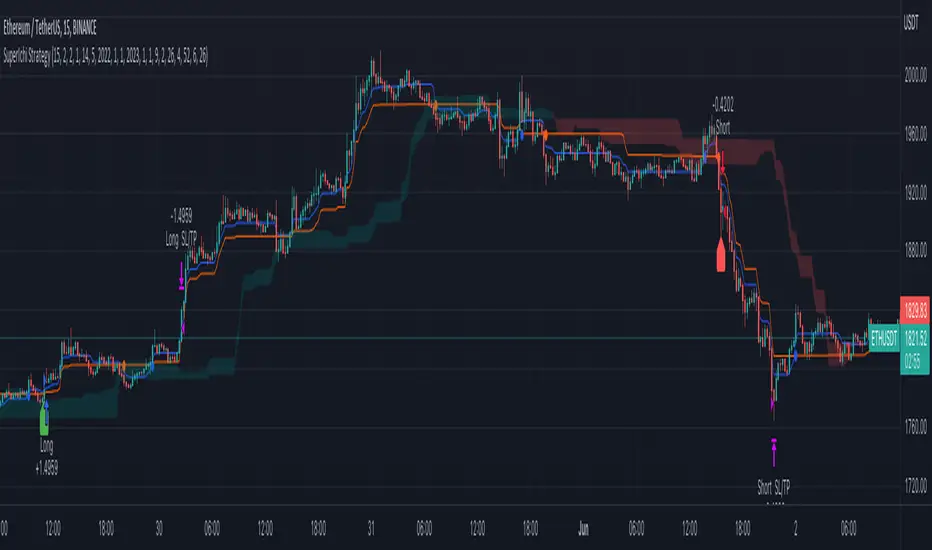
Long entry:
- Tenkan-Sen is above Kijun-Sen (blue line above red line)
- Price closes above both Tenkan-Sen and Kijun-Sen (price closes above both blue and red lines)
- Tenkan-Sen and Kijun-Sen is above Senkou Span (both blue and red lines are above cloud)
- Senkou Span is green (cloud is green)
- Price pulled back and closed below both Tenkan-Sen and Kijun-Sen within last X (configurable in settings) candles (price pulled back below blue and red lines)
Short entry:
- Tenkan-Sen is below Kijun-Sen (blue line below red line)
- Price closes below both Tenkan-Sen and Kijun-Sen (price closes below both blue and red lines)
- Tenkan-Sen and Kijun-Sen is below Senkou Span (both blue and red lines are below cloud)
- Senkou Span is red (cloud is red)
- Price pulled back and closed above both Tenkan-Sen and Kijun-Sen within last X (configurable in settings) candles (price pulled back above blue and red lines)
Risk management:
Each trade risks 2% of account (configurable in settings)
SL size determined by swing low/high of previous X candles (configurable in settings) or using the ATR override (configurable in settings) where the max of swing high/low or ATR value will be used to calculate SL
TP is calculated by Risk:Reward ratio (configurable in settings)
TIPS
Timeframe: I have found best results running on anything 5M and above
CREDITS
SuperIchi [LUX] by LuxAlgo
Release Notes
Removing plots used for debugging purposesOpen-source script
In true TradingView spirit, the creator of this script has made it open-source, so that traders can review and verify its functionality. Kudos to the author! While you can use it for free, remember that republishing the code is subject to our House Rules.
Disclaimer
The information and publications are not meant to be, and do not constitute, financial, investment, trading, or other types of advice or recommendations supplied or endorsed by TradingView. Read more in the Terms of Use.
Open-source script
In true TradingView spirit, the creator of this script has made it open-source, so that traders can review and verify its functionality. Kudos to the author! While you can use it for free, remember that republishing the code is subject to our House Rules.
Disclaimer
The information and publications are not meant to be, and do not constitute, financial, investment, trading, or other types of advice or recommendations supplied or endorsed by TradingView. Read more in the Terms of Use.