OPEN-SOURCE SCRIPT
VWAP Slope
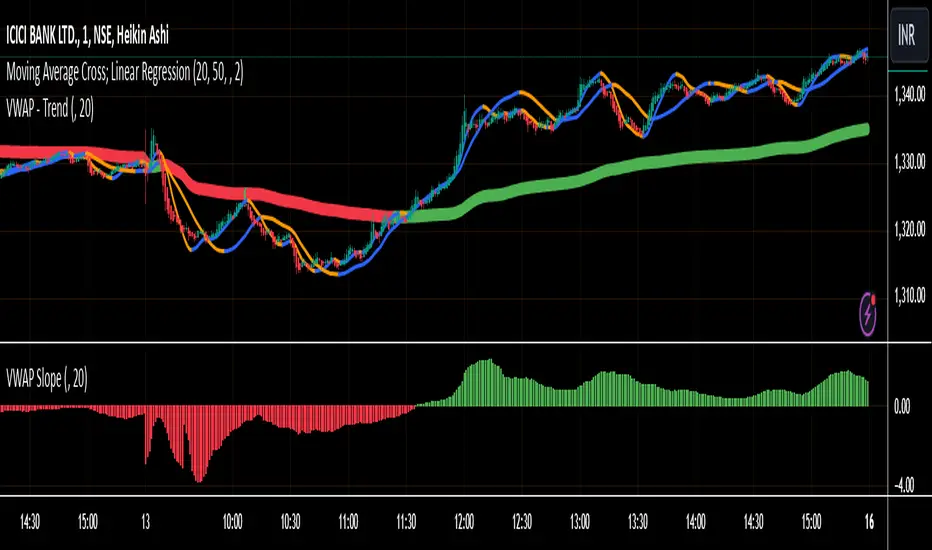
This script calculates and displays the slope of the Volume Weighted Average Price (VWAP). It compares the current VWAP with its value from a user-defined lookback period to determine the slope. The slope is color-coded: green for an upward trend (positive slope) and red for a downward trend (negative slope).
Key Points:
VWAP Calculation: The script calculates the VWAP based on a user-defined timeframe (default: daily), which represents the average price weighted by volume.
Slope Determination: The slope is calculated by comparing the current VWAP to its value from a previous period, providing insight into market trends.
Color-Coding: The slope line is color-coded to visually indicate the market direction: green for uptrend and red for downtrend.
This script helps traders identify the direction of the market based on VWAP, offering a clear view of trends and potential turning points.
Open-source script
In true TradingView spirit, the creator of this script has made it open-source, so that traders can review and verify its functionality. Kudos to the author! While you can use it for free, remember that republishing the code is subject to our House Rules.
Disclaimer
The information and publications are not meant to be, and do not constitute, financial, investment, trading, or other types of advice or recommendations supplied or endorsed by TradingView. Read more in the Terms of Use.