OPEN-SOURCE SCRIPT
Previous High/Low Range (D,W,M,Q)
Previous High/Low Range (D, W, M, Q)
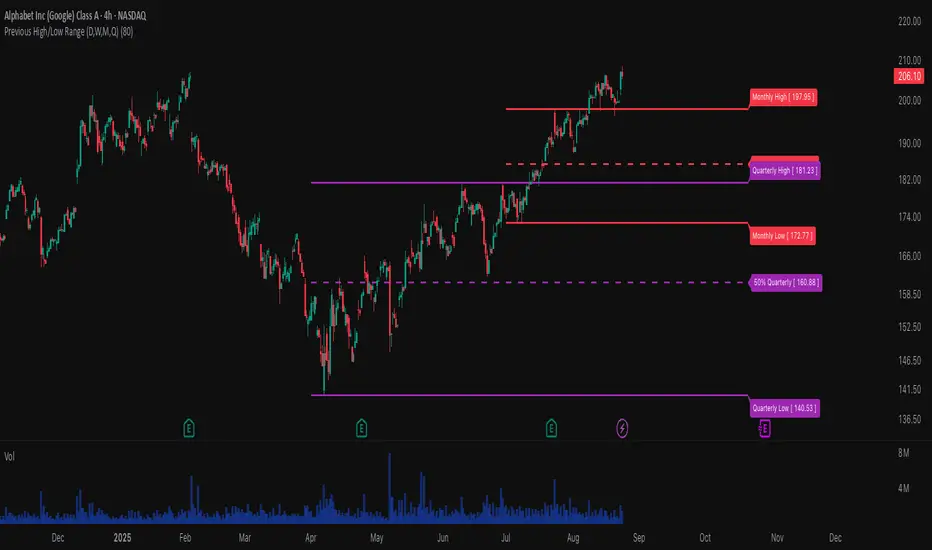
This indicator displays the previous period’s high, low, and midpoint levels across multiple timeframes: Daily, Weekly, Monthly, and Quarterly. It extends these key price levels into the future, allowing traders to quickly identify important support and resistance zones based on historical price action.
Features:
Shows previous Daily, Weekly, Monthly, and Quarterly highs, lows, and midpoints.
Optionally extends these levels forward for easy visualization.
Configurable colors and visibility for each timeframe.
Includes optional midpoint lines at 50% between high and low to identify equilibrium points.
Supports logarithmic scale calculations for midpoints to maintain accuracy on log charts.
Optional labels that display exact price values for each level.
Designed to help traders recognize key levels for entries, exits, and risk management.
Use this indicator to gain a multi-timeframe perspective on significant price ranges and anticipate potential reversal or breakout zones.
Open-source script
In true TradingView spirit, the creator of this script has made it open-source, so that traders can review and verify its functionality. Kudos to the author! While you can use it for free, remember that republishing the code is subject to our House Rules.
Disclaimer
The information and publications are not meant to be, and do not constitute, financial, investment, trading, or other types of advice or recommendations supplied or endorsed by TradingView. Read more in the Terms of Use.