RSI and RSI SMA Signal with Variable Levels
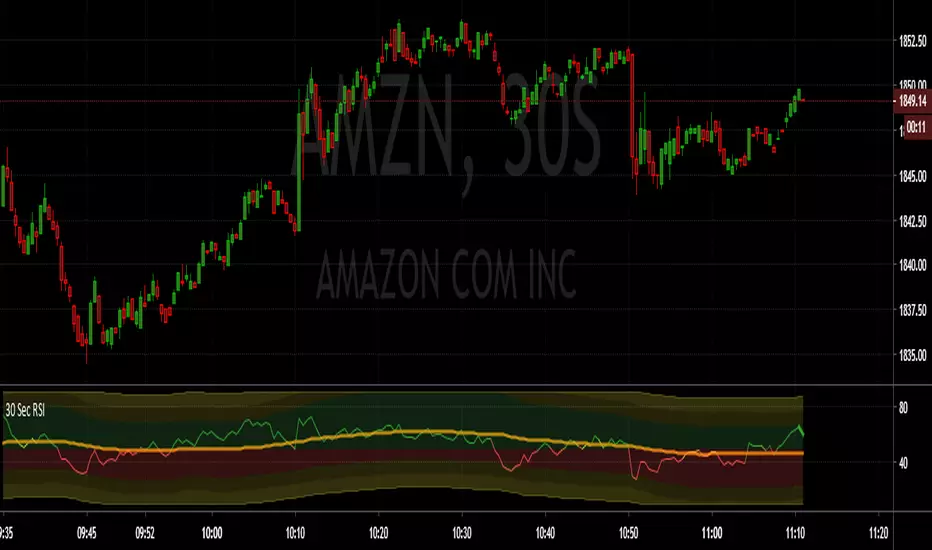
Plots RSI to the existing resolution.
Plots the 50 SMA (sourced from the RSI)
Colors the line red when below the 50 SMA and RSI is below 50.
Colors the line green when above the 50 SMA and RSI is above 50.
Banding:
Green from 50 to 70
Dark yellow from 70-80 and 30-20
Red from 50 to 30
Brighter yellow from 80-90 and 20-10
The banding varies if there is a trend in the 50 SMA that holds below the 50 level. This way it defines the levels safe to maintain a position during and not during a trend.
You will notice that the red area increases and the OS yellow area(s) decreases if a short trend has developed.
You will notice that the green area increases and the OB yellow area(s) decreases if a long trend has developed.
The maximum levels are limited to 90 and 10.
Invite-only script
Only users approved by the author can access this script. You'll need to request and get permission to use it. This is typically granted after payment. For more details, follow the author's instructions below or contact kmack282 directly.
TradingView does NOT recommend paying for or using a script unless you fully trust its author and understand how it works. You may also find free, open-source alternatives in our community scripts.
Author's instructions
Disclaimer
Invite-only script
Only users approved by the author can access this script. You'll need to request and get permission to use it. This is typically granted after payment. For more details, follow the author's instructions below or contact kmack282 directly.
TradingView does NOT recommend paying for or using a script unless you fully trust its author and understand how it works. You may also find free, open-source alternatives in our community scripts.