OPEN-SOURCE SCRIPT
WaveTrend and Crossing EMA of RSIs by Alhazen
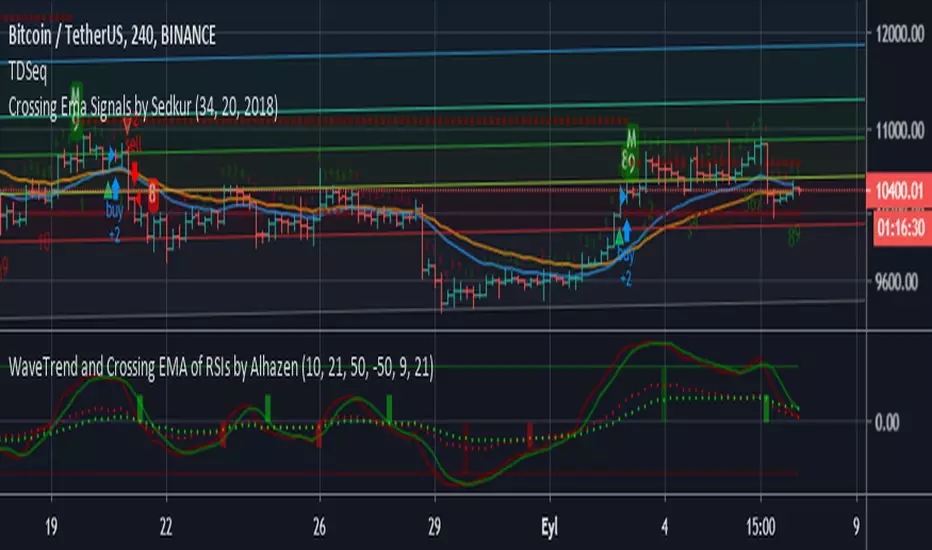
LazyBear's WaveTrend Oscilator is simplified, and buy & sell signals are added. Green bars indicate SELL signal of WT, and Maroon bars indicate BUY signal of WT.
A new indicator added: Crossing EMA of two RSI's. RSI plots are shown with dotted lines. Lime bars indicate SELL signal of RSI, and Red bars indicate BUY signal of RSI.
You can combine WT and RSI together and decide to BUY or SELL.
A new indicator added: Crossing EMA of two RSI's. RSI plots are shown with dotted lines. Lime bars indicate SELL signal of RSI, and Red bars indicate BUY signal of RSI.
You can combine WT and RSI together and decide to BUY or SELL.
Open-source script
In true TradingView spirit, the creator of this script has made it open-source, so that traders can review and verify its functionality. Kudos to the author! While you can use it for free, remember that republishing the code is subject to our House Rules.
Disclaimer
The information and publications are not meant to be, and do not constitute, financial, investment, trading, or other types of advice or recommendations supplied or endorsed by TradingView. Read more in the Terms of Use.