OPEN-SOURCE SCRIPT
Yusram Mount MaV - Day MaV
Yüsram Mount HO - Day HO
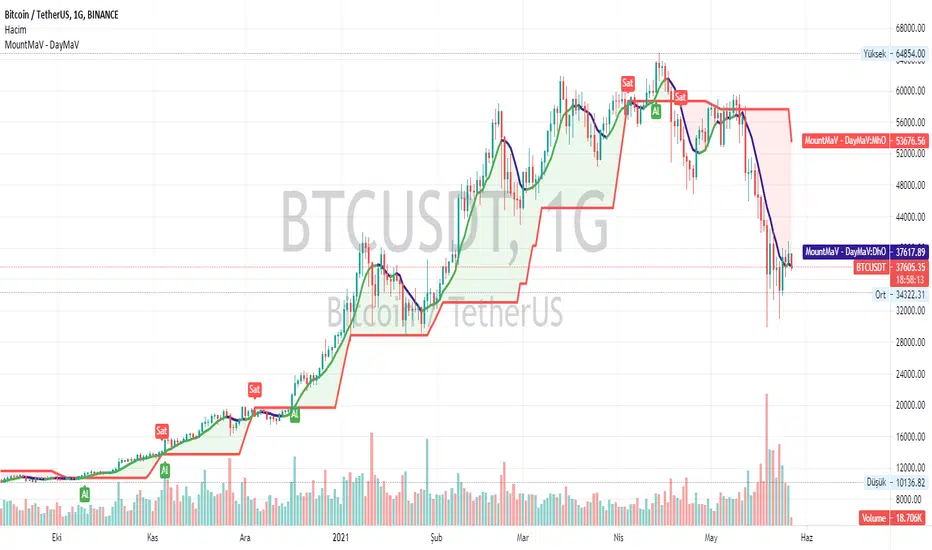
This indicator shows the comparison between the 7-day fast simple average and the monthly slow average of 5 bars. The red line indicates the monthly green and blue lines the daily average. If the Green-Blue line crosses the red upwards, it is a buy signal and the opposite is a sell signal. As soon as it turns green blue without waiting for the sell signal, a sell signal is created. If you are trading fast, you can consider turning green to blue as an opportunity. In the long run, the red intersection can be interpreted as a Stop point.
I hope it will be useful to everyone.
You can also find the strategy indicator with the same name.
I got the name of this indicator from my daughter's name. The meaning of the name Yüsra means "convenience". I hope this indicator will help you.
Open-source script
In true TradingView spirit, the creator of this script has made it open-source, so that traders can review and verify its functionality. Kudos to the author! While you can use it for free, remember that republishing the code is subject to our House Rules.
Disclaimer
The information and publications are not meant to be, and do not constitute, financial, investment, trading, or other types of advice or recommendations supplied or endorsed by TradingView. Read more in the Terms of Use.