OPEN-SOURCE SCRIPT
Updated SMT Divergence [TakingProphets]
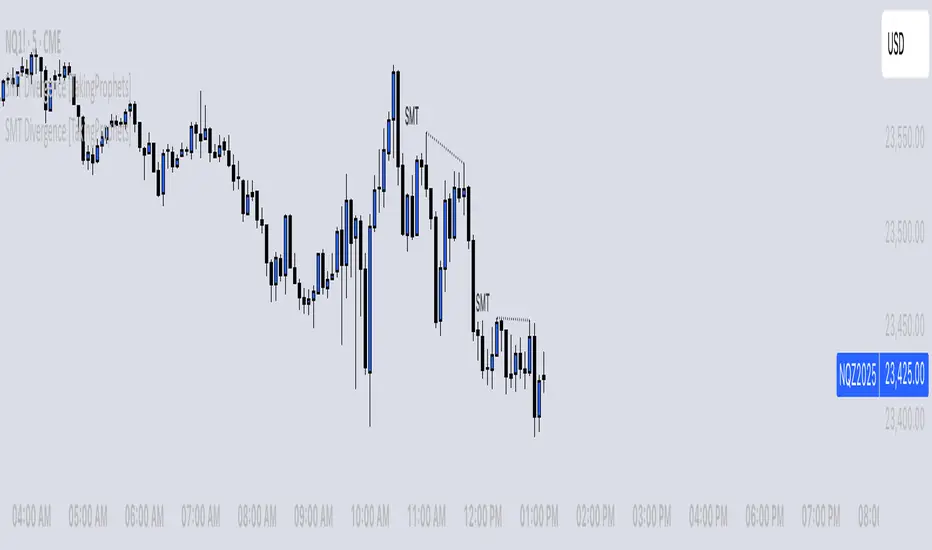
The SMT (Smart Money Technique) Divergence indicator identifies potential market manipulation and smart money footprints by comparing price action between correlated instruments. It uses a dual-detection system to catch both frequent local SMTs and larger structural SMTs:
• Primary detection uses a shorter lookback period (default 5) to identify common SMT patterns
• Secondary detection uses a longer lookback period (default 8) to catch larger structural SMTs
• Automatically filters significant moves to prevent noise
• Labels are placed clearly outside of price action for better visibility
• Toggle between showing all SMTs or only significant liquidity sweeps
Compare any two instruments to spot divergences in their price action. Particularly useful for:
- Futures vs Spot markets
- Related currency pairs
- Index vs its components
- Any correlated instruments
Default settings are optimized for intraday trading but can be adjusted for different timeframes.
Note: This indicator works best when comparing closely correlated instruments and should be used alongside other technical analysis tools.
Release Notes
The SMT (Smart Money Technique) Divergence indicator identifies potential market manipulation and smart money footprints by comparing price action between correlated instruments. It uses a dual-detection system to catch both frequent local SMTs and larger structural SMTs:• Primary detection uses a shorter lookback period (default 5) to identify common SMT patterns
• Secondary detection uses a longer lookback period (default 8) to catch larger structural SMTs
• Automatically filters significant moves to prevent noise
• Labels are placed clearly outside of price action for better visibility
• Toggle between showing all SMTs or only significant liquidity sweeps
Compare any two instruments to spot divergences in their price action. Particularly useful for:
- Futures vs Spot markets
- Related currency pairs
- Index vs its components
- Any correlated instruments
Default settings are optimized for intraday trading but can be adjusted for different timeframes.
Note: This indicator works best when comparing closely correlated instruments and should be used alongside other technical analysis tools.
Release Notes
OverviewThe SMT Divergence indicator is a powerful tool for Forex and Futures traders following Inner Circle Trader (ICT) concepts. It detects Smart Money Technique (SMT) divergences by comparing price action between two correlated instruments—typically a primary asset (e.g., NQ, ES, DXY) and a comparison symbol (e.g., another index, currency pair, or bond).
By identifying liquidity sweeps and institutional order flow, this tool helps traders spot Smart Money accumulation and distribution, false breakouts, and market inefficiencies.
📌 A must-have for traders looking to align with Smart Money movements and avoid retail traps.
Key Features & Functions
✅ Automatic SMT Divergence Detection
Compares swing highs and lows between a primary asset and a comparison asset.
Highlights when one market sweeps liquidity while the other does not, signaling institutional price action.
Uses pivot-based swing detection to ensure accurate divergence signals.
✅ Dual SMT Detection System
Primary SMT (Short-Term, Default Lookback: 5 bars): Captures frequent SMT divergences useful for intraday trading.
Secondary SMT (Longer-Term, Default Lookback: 8 bars): Identifies higher timeframe Smart Money moves for swing trading.
✅ Customizable Settings for Enhanced Clarity
Select your comparison asset (e.g., ES1! vs NQ1!, DXY vs EUR/USD).
Enable or disable significant SMTs only, filtering out weaker divergences.
Adjust line colors, styles, and label sizes for better chart visualization.
✅ Liquidity Sweep Identification
Highlights buy-side and sell-side liquidity grabs, confirming Smart Money's presence in the market. Detects SMT-based stop hunts, where institutions manipulate liquidity before reversals.
✅ Optimized for Forex & Futures Trading
Designed for currency pairs, indices, and bonds.
Works across all timeframes, making it useful for both scalpers and swing traders.
How to Use:
1️⃣ Spot SMT Divergences for High-Probability Trades
Bullish SMT Divergence:
One instrument sweeps sell-side liquidity, but the comparison asset holds its low → Possible reversal higher.
Bearish SMT Divergence:
One instrument takes buy-side liquidity, but the comparison asset fails to make a new high → Potential drop ahead.
2️⃣ Confirm Institutional Liquidity Manipulation
Combine SMT signals with:
✅ Fair Value Gaps (FVGs)
✅ Order Blocks (OBs)
✅ Market Structure Shifts (CHoCH/BOS)
SMT divergence at key liquidity levels strengthens trade confluence and reliability.
3️⃣ Use SMT in Key Market Correlations
Forex Example: EUR/USD vs. DXY – If the Dollar Index (DXY) takes out liquidity while EUR/USD does not, Smart Money might be preparing for a reversal.
Futures Example: ES vs. NQ – If S&P 500 (ES) breaks a high but Nasdaq (NQ) does not, this signals potential weakness in indices.
4️⃣ Customize for Your Trading Style
Short-term traders can use a 5-bar lookback for fast SMT detection.
Swing traders can use an 8-bar lookback for stronger divergence setups.
Adjust line styles, label sizes, and divergence filtering to match your strategy.
📌 Pro Tip: SMT works best when used alongside liquidity concepts, Fair Value Gaps, and Order Blocks for high-probability setups.
Why Use This Indicator?
🚀 Track Institutional Order Flow – Identify where Smart Money is trapping retail traders.
📊 Improve Trade Accuracy – Confirm liquidity grabs and avoid getting caught in false breakouts.
🔎 Filter Out Low-Quality Setups – Use only significant SMT divergences to refine trade selection.
💡 Stay Ahead of the Market – Understand how correlated assets interact and position yourself with Smart Money.
Release Notes
-Updated ChartRelease Notes
-Improved logic and cleanup functionality Release Notes
-Updated publicationOpen-source script
In true TradingView spirit, the creator of this script has made it open-source, so that traders can review and verify its functionality. Kudos to the author! While you can use it for free, remember that republishing the code is subject to our House Rules.
Disclaimer
The information and publications are not meant to be, and do not constitute, financial, investment, trading, or other types of advice or recommendations supplied or endorsed by TradingView. Read more in the Terms of Use.
Open-source script
In true TradingView spirit, the creator of this script has made it open-source, so that traders can review and verify its functionality. Kudos to the author! While you can use it for free, remember that republishing the code is subject to our House Rules.
Disclaimer
The information and publications are not meant to be, and do not constitute, financial, investment, trading, or other types of advice or recommendations supplied or endorsed by TradingView. Read more in the Terms of Use.