OPEN-SOURCE SCRIPT
Big 4 EMA Trend Dashboard
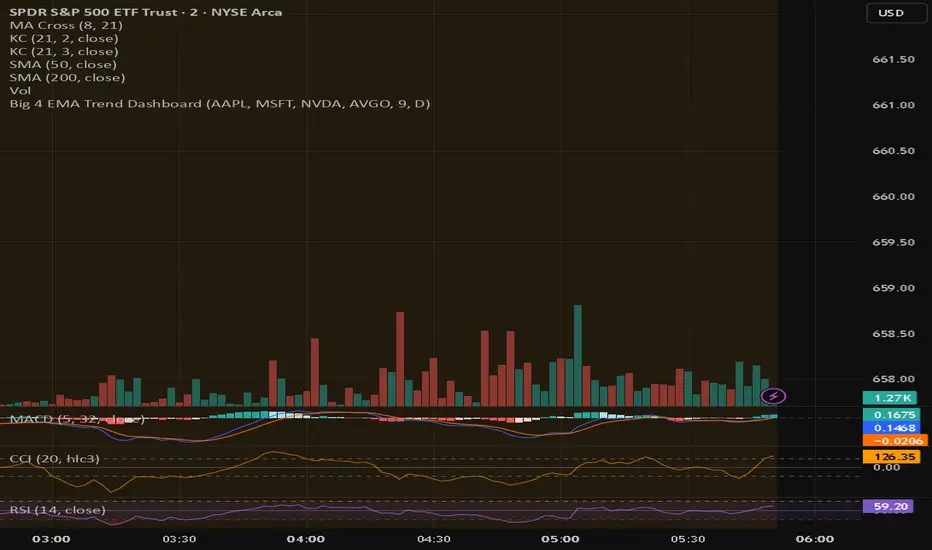
Quickly see the trend direction of your top four stocks using a customizable EMA. Each stock shows as a colored tile: green if price is above the EMA, red if below. A summary label shows whether all four stocks are trending up, down, or mixed.
Key Features:
Track 4 user-defined symbols at a glance
Custom EMA length and optional timeframe override
Compact dashboard ideal for scalping and day trading
Key Features:
Track 4 user-defined symbols at a glance
Custom EMA length and optional timeframe override
Compact dashboard ideal for scalping and day trading
Open-source script
In true TradingView spirit, the creator of this script has made it open-source, so that traders can review and verify its functionality. Kudos to the author! While you can use it for free, remember that republishing the code is subject to our House Rules.
Disclaimer
The information and publications are not meant to be, and do not constitute, financial, investment, trading, or other types of advice or recommendations supplied or endorsed by TradingView. Read more in the Terms of Use.