PROTECTED SOURCE SCRIPT
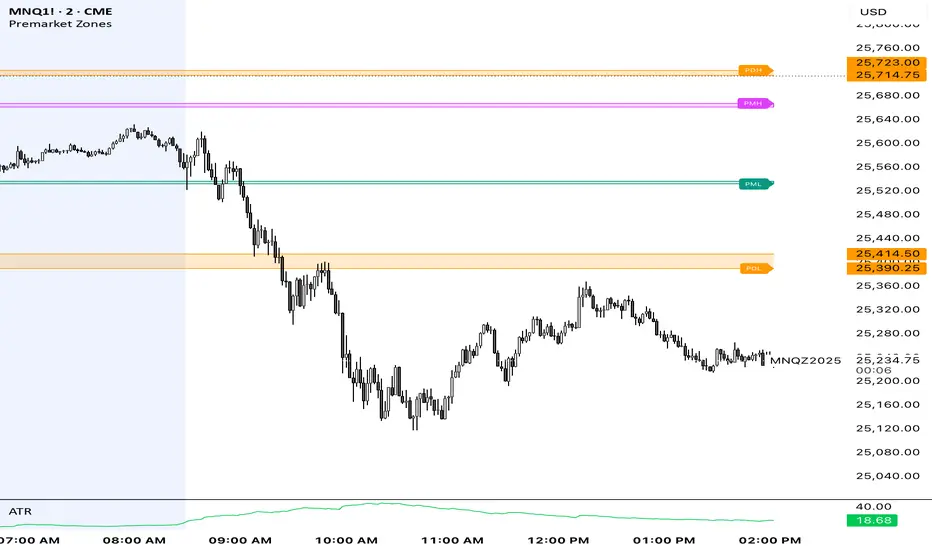
Premarket Zones
This indicator is built for index futures traders (ES, NQ, RTY, YM) who trade liquidity, session structure, and high-probability reaction levels using true CME futures timing.
It automatically plots:
Premarket High & Low zones (wick + body)
Previous Day Futures RTH High & Low zones (PDH / PDL)
Clean right-edge labels
First-touch alerts (once per day)
All calculations are based on Central Time (CT) and CME futures sessions, not equity cash-market hours.
🕒 Session Definitions (CME / Central Time)
Session Time (CT) Purpose
Premarket 03:00 – 08:30 Overnight liquidity build
Futures RTH (Calc) 08:30 – 15:00 True CME regular trading hours
Plot Window 03:00 – 16:00 Visual extension of zones
This script intentionally uses 08:30 CT as the futures open — not 09:30 equity cash open.
🔷 Premarket Zones (PMH / PML)
The indicator builds two premarket zones using multi-timeframe precision.
How they are calculated:
1-minute candles → capture the true wick extremes
5-minute candles → capture the dominant body area
Zones:
Premarket High Zone (PMH)
Between the highest 5-minute candle body and the highest 1-minute wick
Premarket Low Zone (PML)
Between the lowest 1-minute wick and the lowest 5-minute candle body
Key behavior:
Zones finalize at 08:30 CT
Once finalized, zones are drawn as boxes that extend left to 03:00 CT
Zones extend forward through the trading day for context
PMH / PML labels are plotted on the right edge
These zones represent overnight liquidity pools commonly used for:
Opening drive continuation
Liquidity sweeps
Mean reversion
Acceptance vs rejection at the open
🔶 Previous Day High / Low (PDH / PDL)
This script plots TRUE futures PDH / PDL, not equity-based levels.
How they are calculated:
Uses only the prior day’s futures RTH (08:30–15:00 CT)
1-minute candles → wick extremes
5-minute candles → body value areas
Zones:
PDH Zone: 5m body → 1m wick
PDL Zone: 1m wick → 5m body
These levels represent:
Institutional reference points
Prior session balance extremes
High-probability reaction zones
Clean PDH / PDL labels are plotted on the right edge.
🔔 Alerts (Once Per Day)
The indicator includes first-touch alerts for:
PDH
PDL
Premarket High Zone
Premarket Low Zone
Each alert triggers only once per session, making it ideal for:
Trade planning
Discipline-based execution
Prop firm risk control
📈 How Traders Use This Script
This indicator is context-based, not predictive.
Common use cases:
Waiting for liquidity sweeps into PMH / PML
Trading rejection or acceptance at PDH / PDL
Combining with:
VWAP
Opening Range
Market structure
Volume or delta tools
It works especially well on:
Opening range days
Mean-reversion conditions
Trend continuation days after overnight imbalance
🎯 Design Philosophy
Futures-first logic
No clutter
No repainting
No equity-market assumptions
Levels professionals actually use
This script is designed to mirror how professional futures traders map their charts.
⚠️ Notes
Best used on 1m or 5m charts
Designed for CME index futures
Not a standalone trading system
Always manage risk
Protected script
This script is published as closed-source. However, you can use it freely and without any limitations – learn more here.
Disclaimer
The information and publications are not meant to be, and do not constitute, financial, investment, trading, or other types of advice or recommendations supplied or endorsed by TradingView. Read more in the Terms of Use.