OPEN-SOURCE SCRIPT
Updated Greer Fair Value
✅ Greer Fair Value
Greer Fair Value: Graham intrinsic value + Buffett-style DCF with auto EPS/FCF and auto growth (CAGR of FCF/share), defaulting to a simple GFV badge that color-codes opportunity at a glance.
📜 Full description
Greer Fair Value is inspired by the valuation frameworks of Benjamin Graham and Warren Buffett. It combines Graham’s rate-adjusted intrinsic value with a two-stage, per-share DCF. The script auto-populates EPS (TTM) and Free Cash Flow per share (FY/FQ/TTM) from request.financial(), and can auto-estimate the near-term growth rate (g₁) using the CAGR of FCF/share over a user-selected lookback (with sensible caps). All assumptions remain editable.
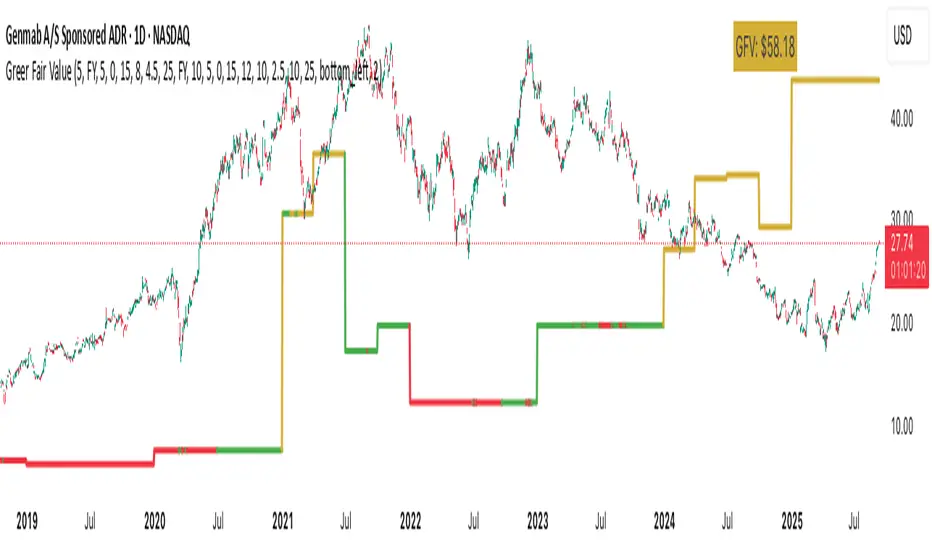
Default view: only the GFV badge is shown to keep charts clean.
Badge color logic:
Gold — both DCF and Graham fair values are above the current price
Green — exactly one of them is above the current price
Red — the current price is above both values
Show more detail (optional):
Toggle “Show Graham Lines” and/or “Show DCF Lines” to plot fair values (and optional MoS bands) over time.
Toggle “Show Dashboard” for a compact data table of assumptions and outputs.
Optional summary label can be enabled for a quick on-chart readout.
Inputs you can customize: EPS source/manual fallback, FCF/share source (FY/FQ/TTM), g₁ auto-CAGR lookback & caps, terminal growth gT, discount rate r, MoS levels, step-style plots, table position, and decimals.
Note: TradingView’s UI controls whether “Inputs/Values in Status Line” are shown. If you prefer a clean status line, open the indicator’s settings and uncheck those options, then Save as default.
Disclaimer: For educational/informational purposes only; not financial advice. Markets involve risk—do your own research.
Greer Fair Value: Graham intrinsic value + Buffett-style DCF with auto EPS/FCF and auto growth (CAGR of FCF/share), defaulting to a simple GFV badge that color-codes opportunity at a glance.
📜 Full description
Greer Fair Value is inspired by the valuation frameworks of Benjamin Graham and Warren Buffett. It combines Graham’s rate-adjusted intrinsic value with a two-stage, per-share DCF. The script auto-populates EPS (TTM) and Free Cash Flow per share (FY/FQ/TTM) from request.financial(), and can auto-estimate the near-term growth rate (g₁) using the CAGR of FCF/share over a user-selected lookback (with sensible caps). All assumptions remain editable.
Default view: only the GFV badge is shown to keep charts clean.
Badge color logic:
Gold — both DCF and Graham fair values are above the current price
Green — exactly one of them is above the current price
Red — the current price is above both values
Show more detail (optional):
Toggle “Show Graham Lines” and/or “Show DCF Lines” to plot fair values (and optional MoS bands) over time.
Toggle “Show Dashboard” for a compact data table of assumptions and outputs.
Optional summary label can be enabled for a quick on-chart readout.
Inputs you can customize: EPS source/manual fallback, FCF/share source (FY/FQ/TTM), g₁ auto-CAGR lookback & caps, terminal growth gT, discount rate r, MoS levels, step-style plots, table position, and decimals.
Note: TradingView’s UI controls whether “Inputs/Values in Status Line” are shown. If you prefer a clean status line, open the indicator’s settings and uncheck those options, then Save as default.
Disclaimer: For educational/informational purposes only; not financial advice. Markets involve risk—do your own research.
Release Notes
📢 Release Notes – Greer Fair Value (v2.x)🔑 New Feature
Auto EPS Growth for Graham Model
• The Graham FV calculation now supports automatic EPS growth estimation using CAGR of EPS (TTM) over a configurable lookback period (default: 5 years).
• Growth is automatically capped/floored with user-defined limits, and both the raw and capped values are shown in the tooltip for transparency.
• This mirrors the existing Auto Growth logic already available for the DCF model (based on FCF/share CAGR).
🛠 Enhancements
Greer Fair Value Badge Tooltip
• Expanded to display full details of both valuation models.
• For Graham FV: now shows EPS growth (raw vs capped), EPS (TTM), and AAA yield.
• For DCF FV: continues to show FCF/share, growth rate (raw vs capped), discount rate, and terminal growth.
🎨 Visual
The badge still uses the Gold / Green / Red scheme:
• Gold → Price is below both valuations (strongest signal)
• Green → Price is below one valuation
• Red → Price is above both valuations
Tooltip provides the “why” behind the signal so users can verify assumptions at a glance.
⚠️ Reminder
This indicator is for educational purposes only and should not be taken as financial advice. Always do your own due diligence before investing.
Release Notes
Release Notes – Greer Fair Value (v2.1) New Feature:
Margin of Safety Line: Added a new line representing the lower Margin of Safety (MoS) value between the Graham EPS fair value and the DCF Free Cash Flow model. This line mirrors the color of the Greer Fair Value badge (Gold, Green, Red, or Gray) to reflect the valuation status over time. A price below this line indicates a potential buying opportunity due to undervaluation.
Enhancements:
Improved user control with a toggle ("Show Greer Fair Value Margin of Safety Line") to enable/disable the new line, defaulting to on for visibility.
The line uses a thicker line-width (3) to stand out against other plots.
Notes:
This update builds on v2.0’s auto EPS growth and tooltip enhancements, maintaining full customizability.
Tested on daily timeframes; performance on lower timeframes may vary.
Release Notes
Release Notes (v2.2):- Enhancement: Repositioned the Greer Fair Value badge to the left in the top-right corner to prevent overlap with other indicators, such as the Greer Value indicator, allowing both badges to be visible simultaneously.
Open-source script
In true TradingView spirit, the creator of this script has made it open-source, so that traders can review and verify its functionality. Kudos to the author! While you can use it for free, remember that republishing the code is subject to our House Rules.
Disclaimer
The information and publications are not meant to be, and do not constitute, financial, investment, trading, or other types of advice or recommendations supplied or endorsed by TradingView. Read more in the Terms of Use.